Workflows dashboard
Each app includes a workflows dashboard accessible at: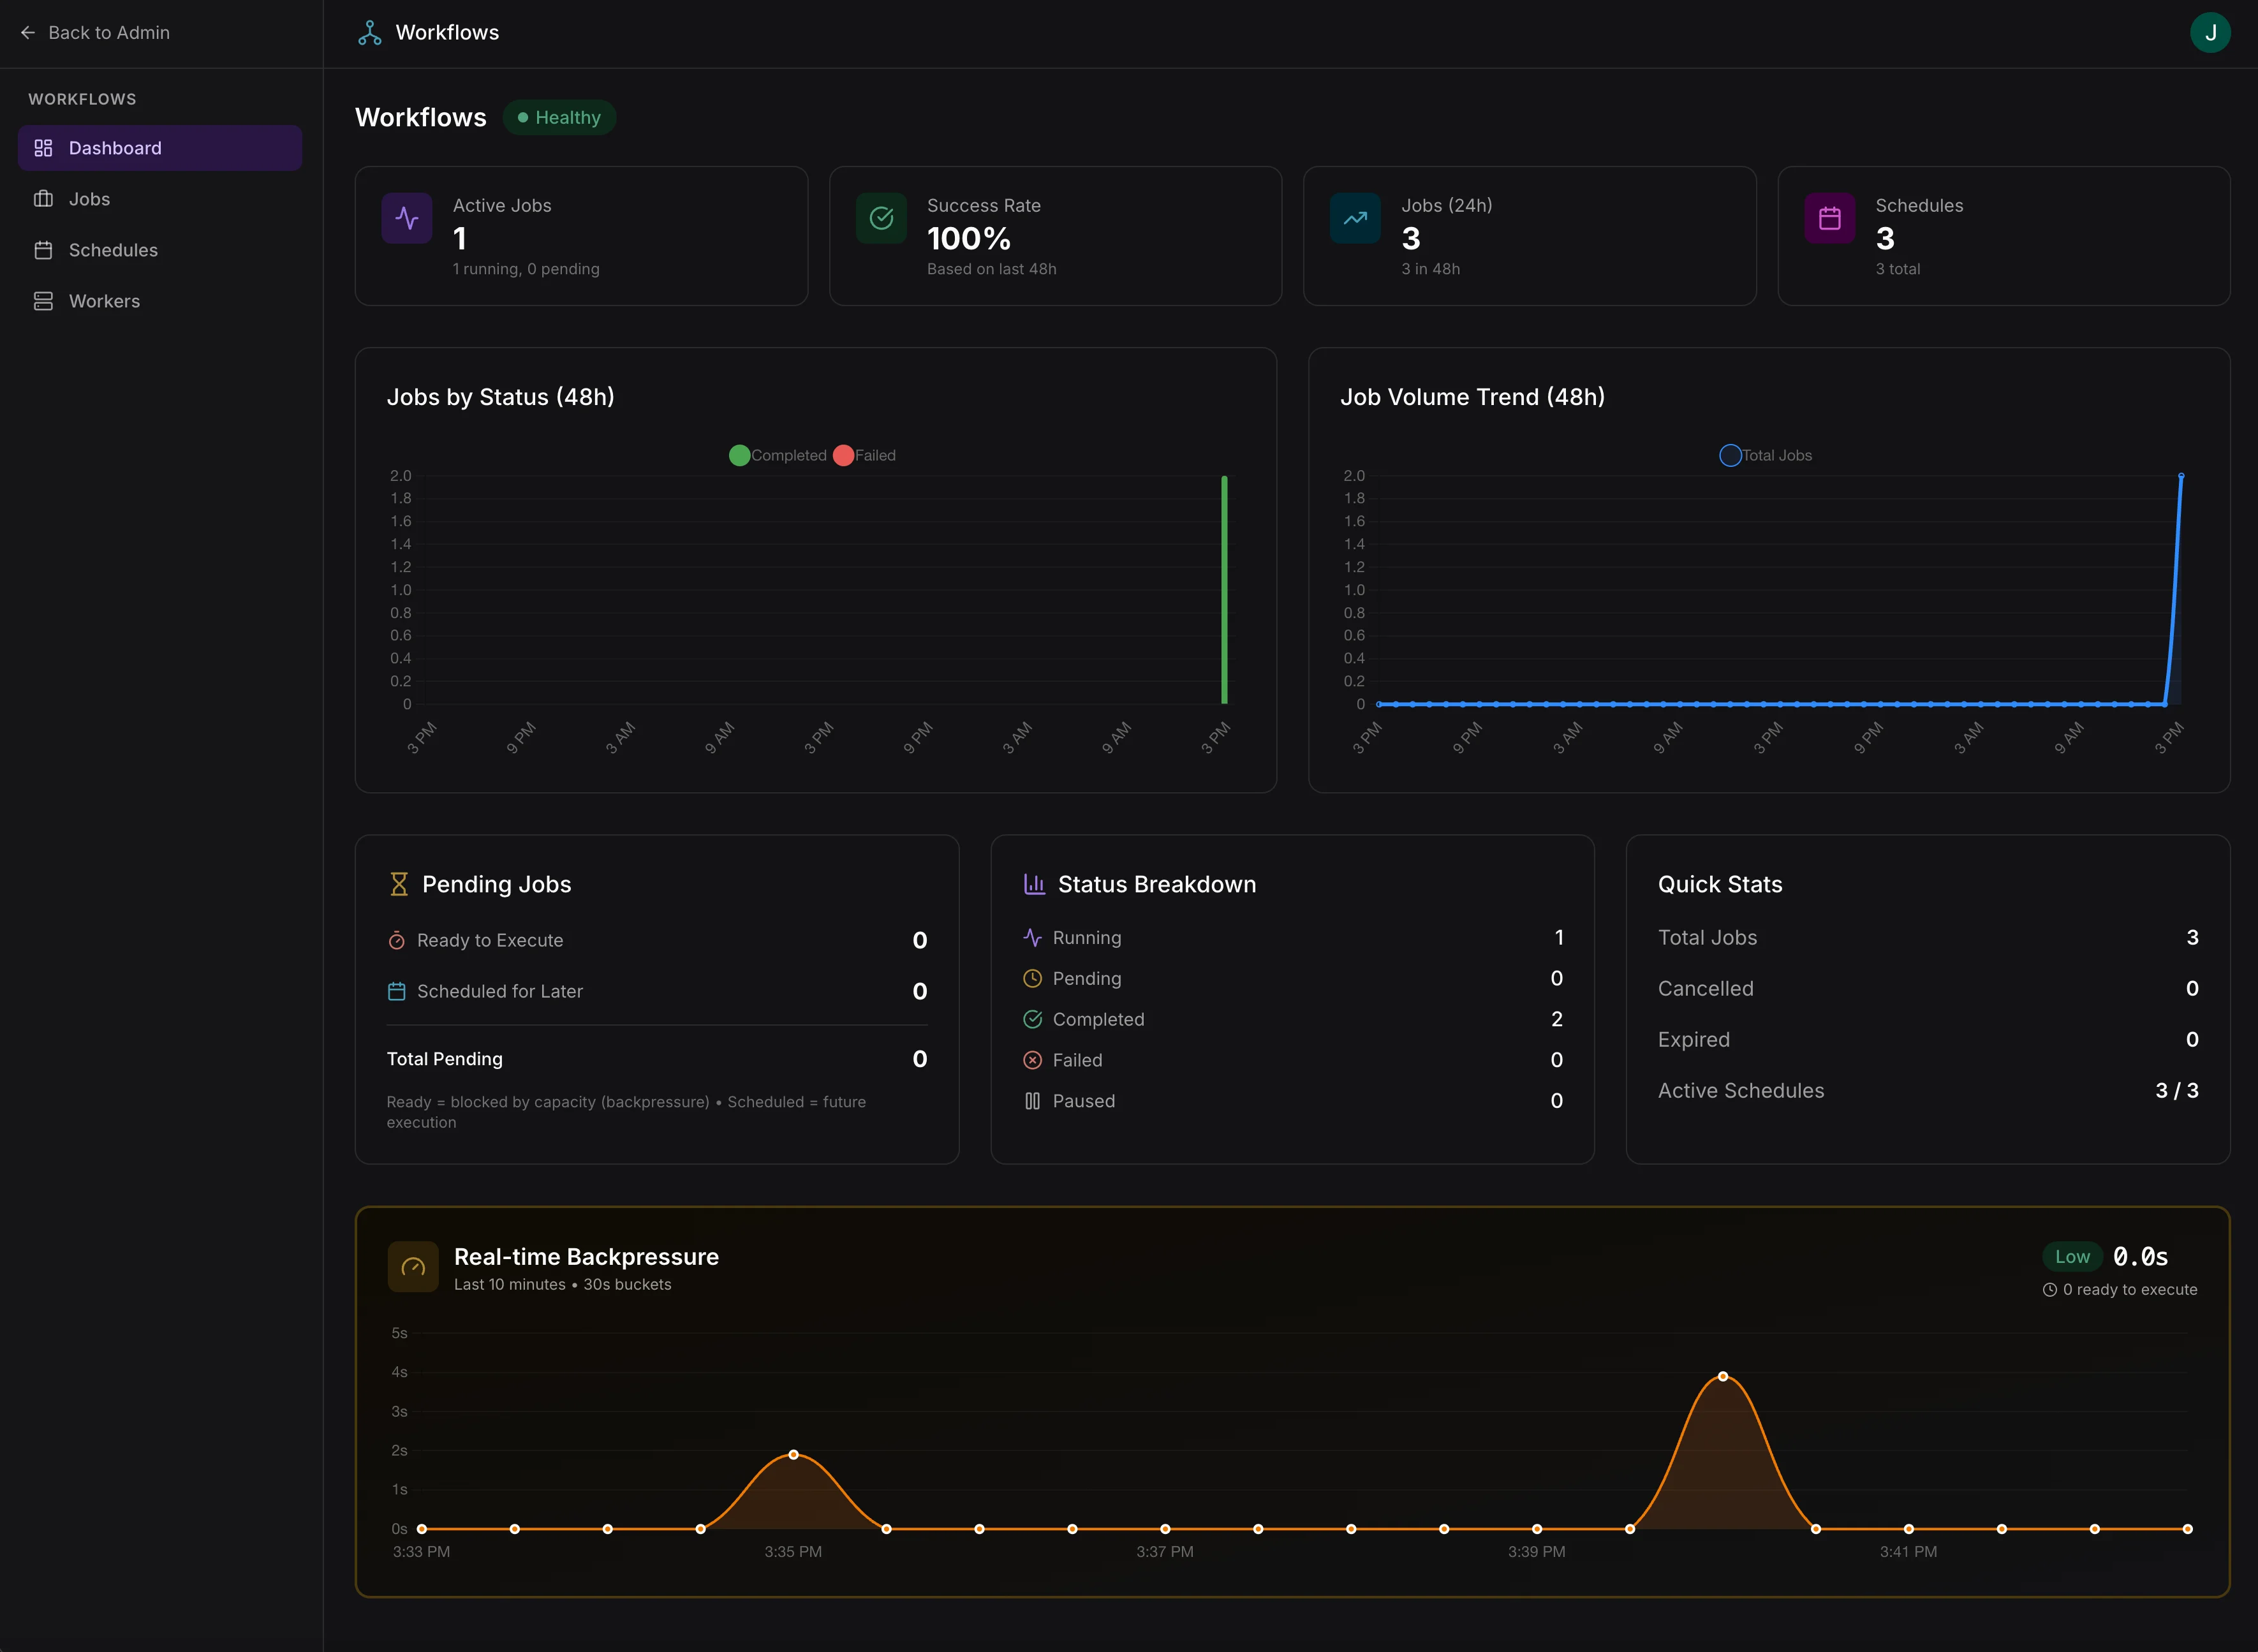
Workflows dashboard with system health, job status, and real-time backpressure monitoring
Access requires the
workflows:admin scope. Assign this scope to admin roles in your app’s access control configuration.Dashboard overview
- System health — overall status (Healthy, Degraded, Idle) based on job success rate and queue pressure
- Active jobs — running and pending job counts
- Success rate — based on the last 48 hours
- Job volume — trend charts for completed and failed jobs
- Backpressure — real-time monitoring of queue pressure
Job management
- Filter jobs by status (Running, Pending, Completed, Failed, Cancelled, Expired)
- Filter by scheduled vs manually triggered
- Cancel, pause, or resume individual jobs
- Bulk cancel all active jobs
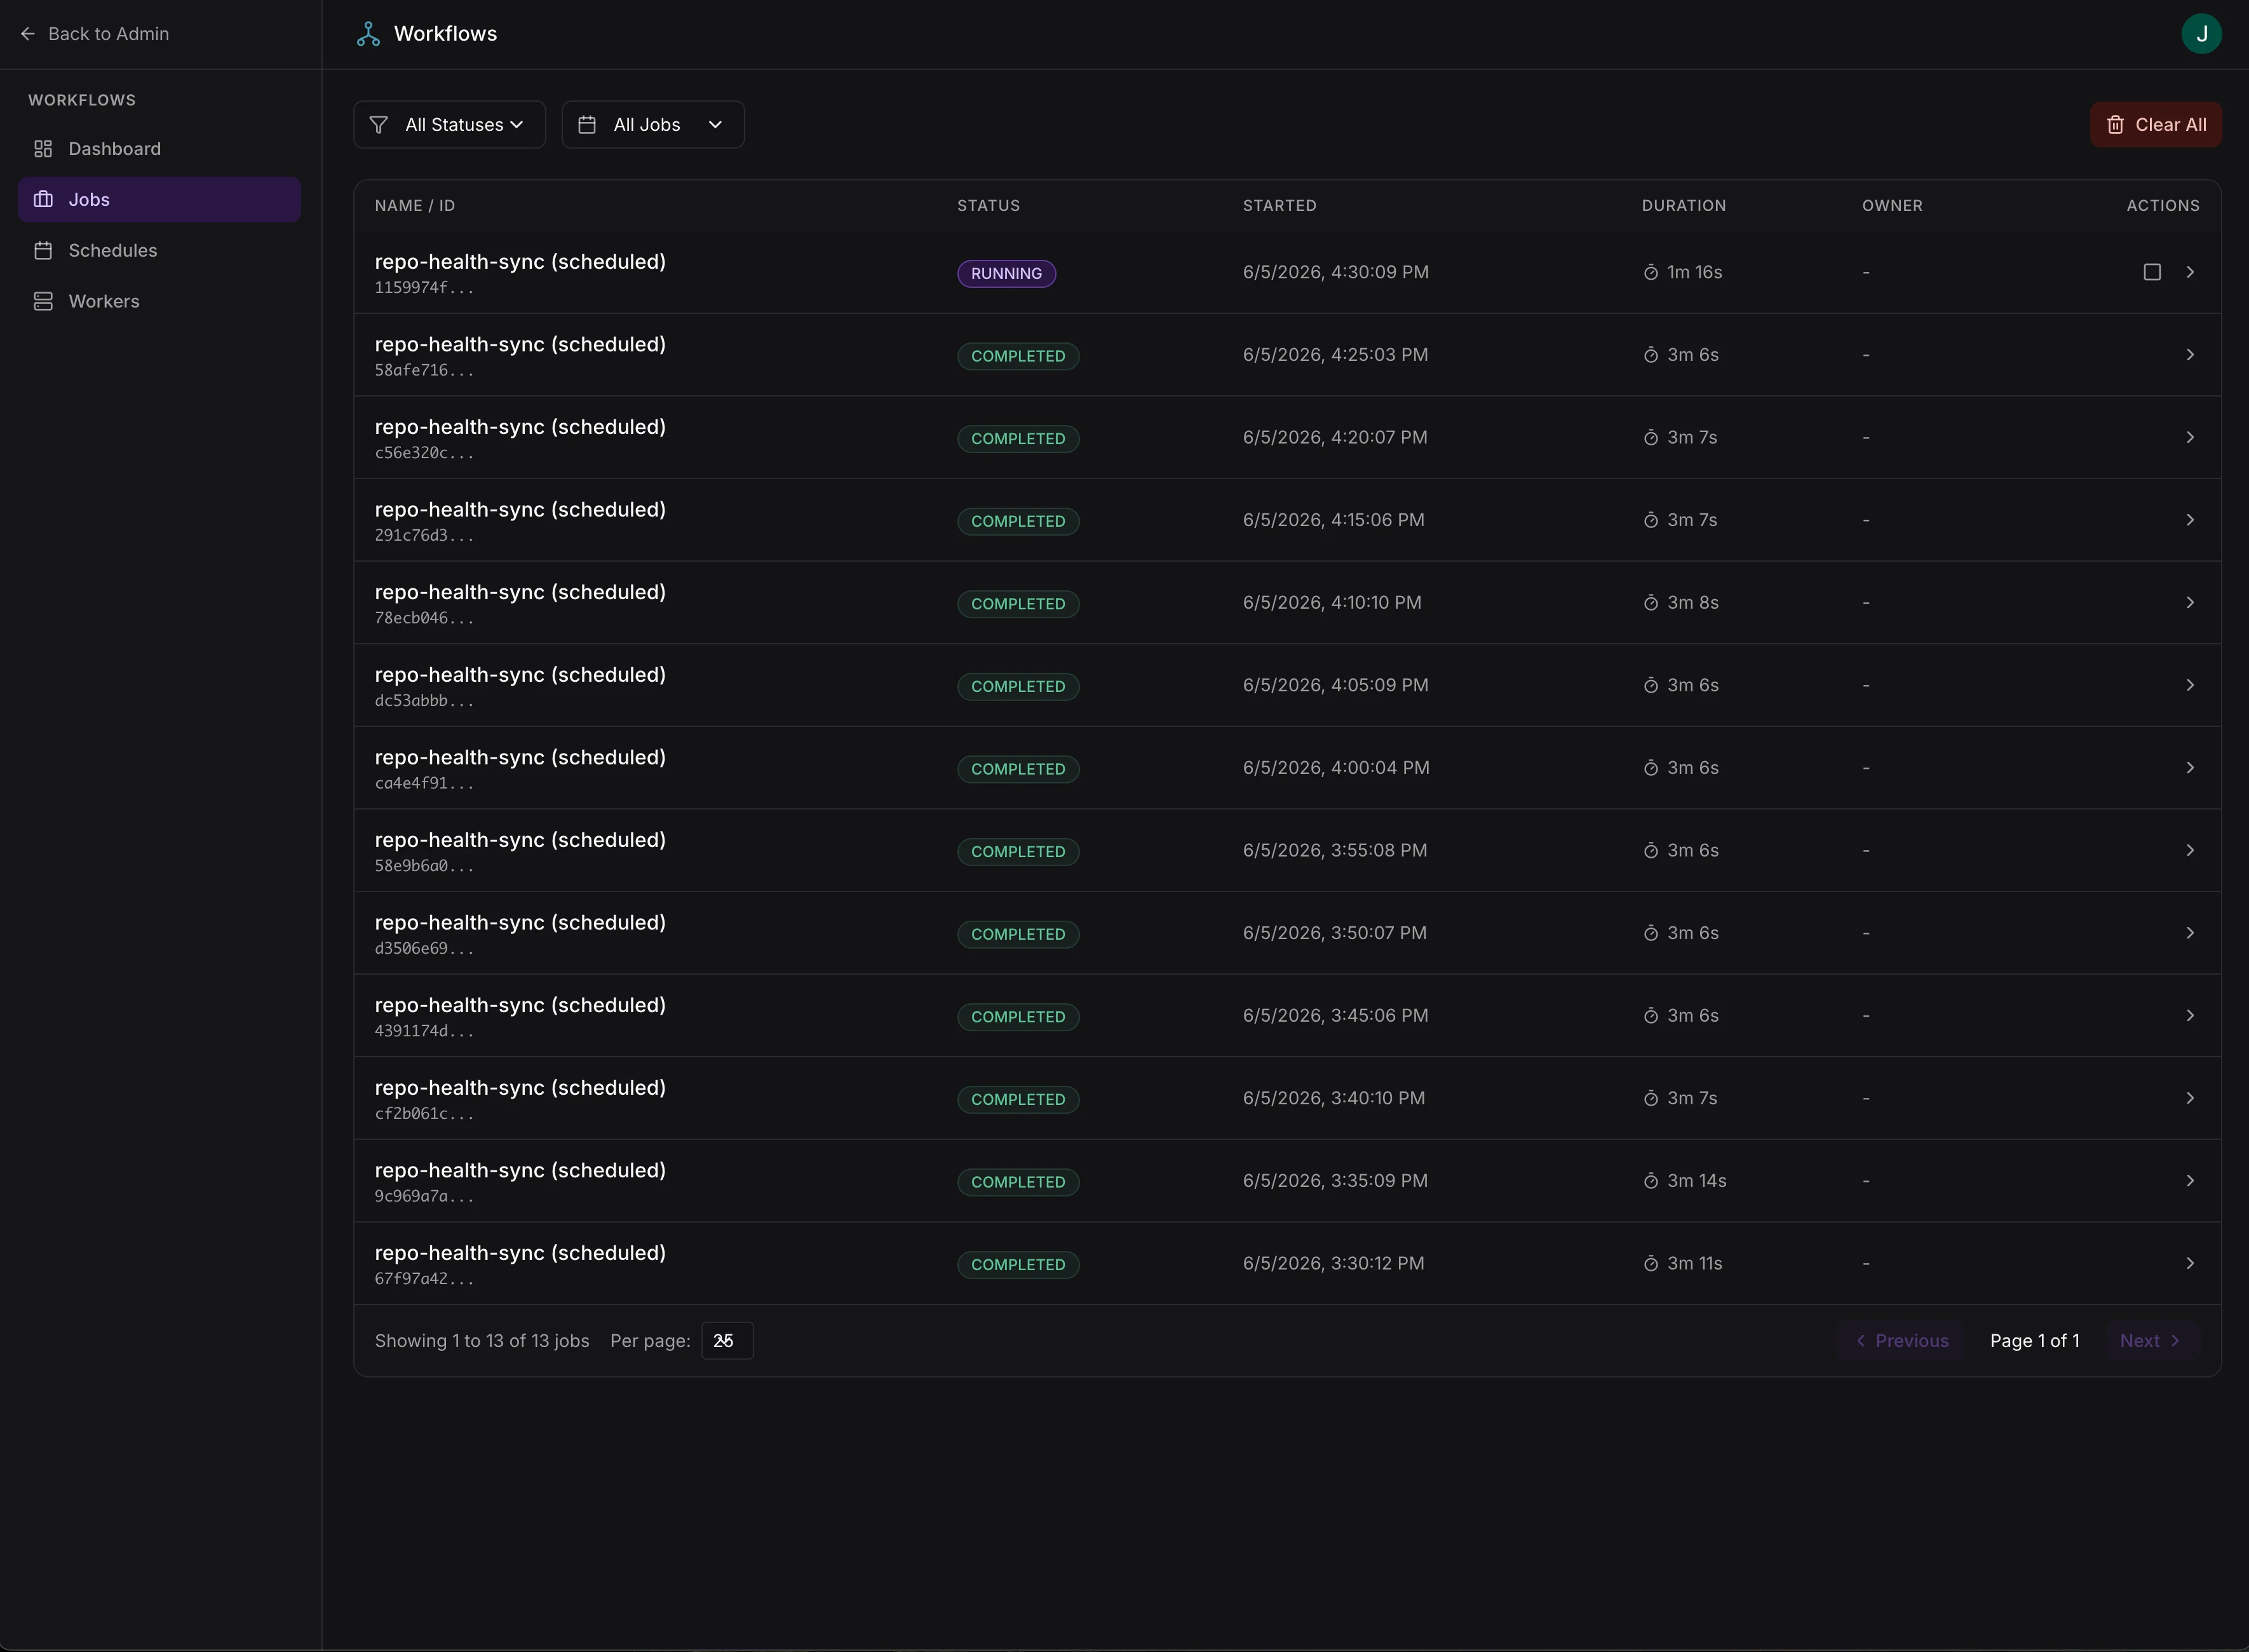
Job management with status filtering and lifecycle controls
Job details
- Overview — progress, timing, errors, and output tables with a live SQL query interface for exploring individual step results
- Steps — step-by-step execution details including status, timing, retries, and error logs
- DAG — visual dependency graph of workflow steps
- Definition — full workflow definition as JSON
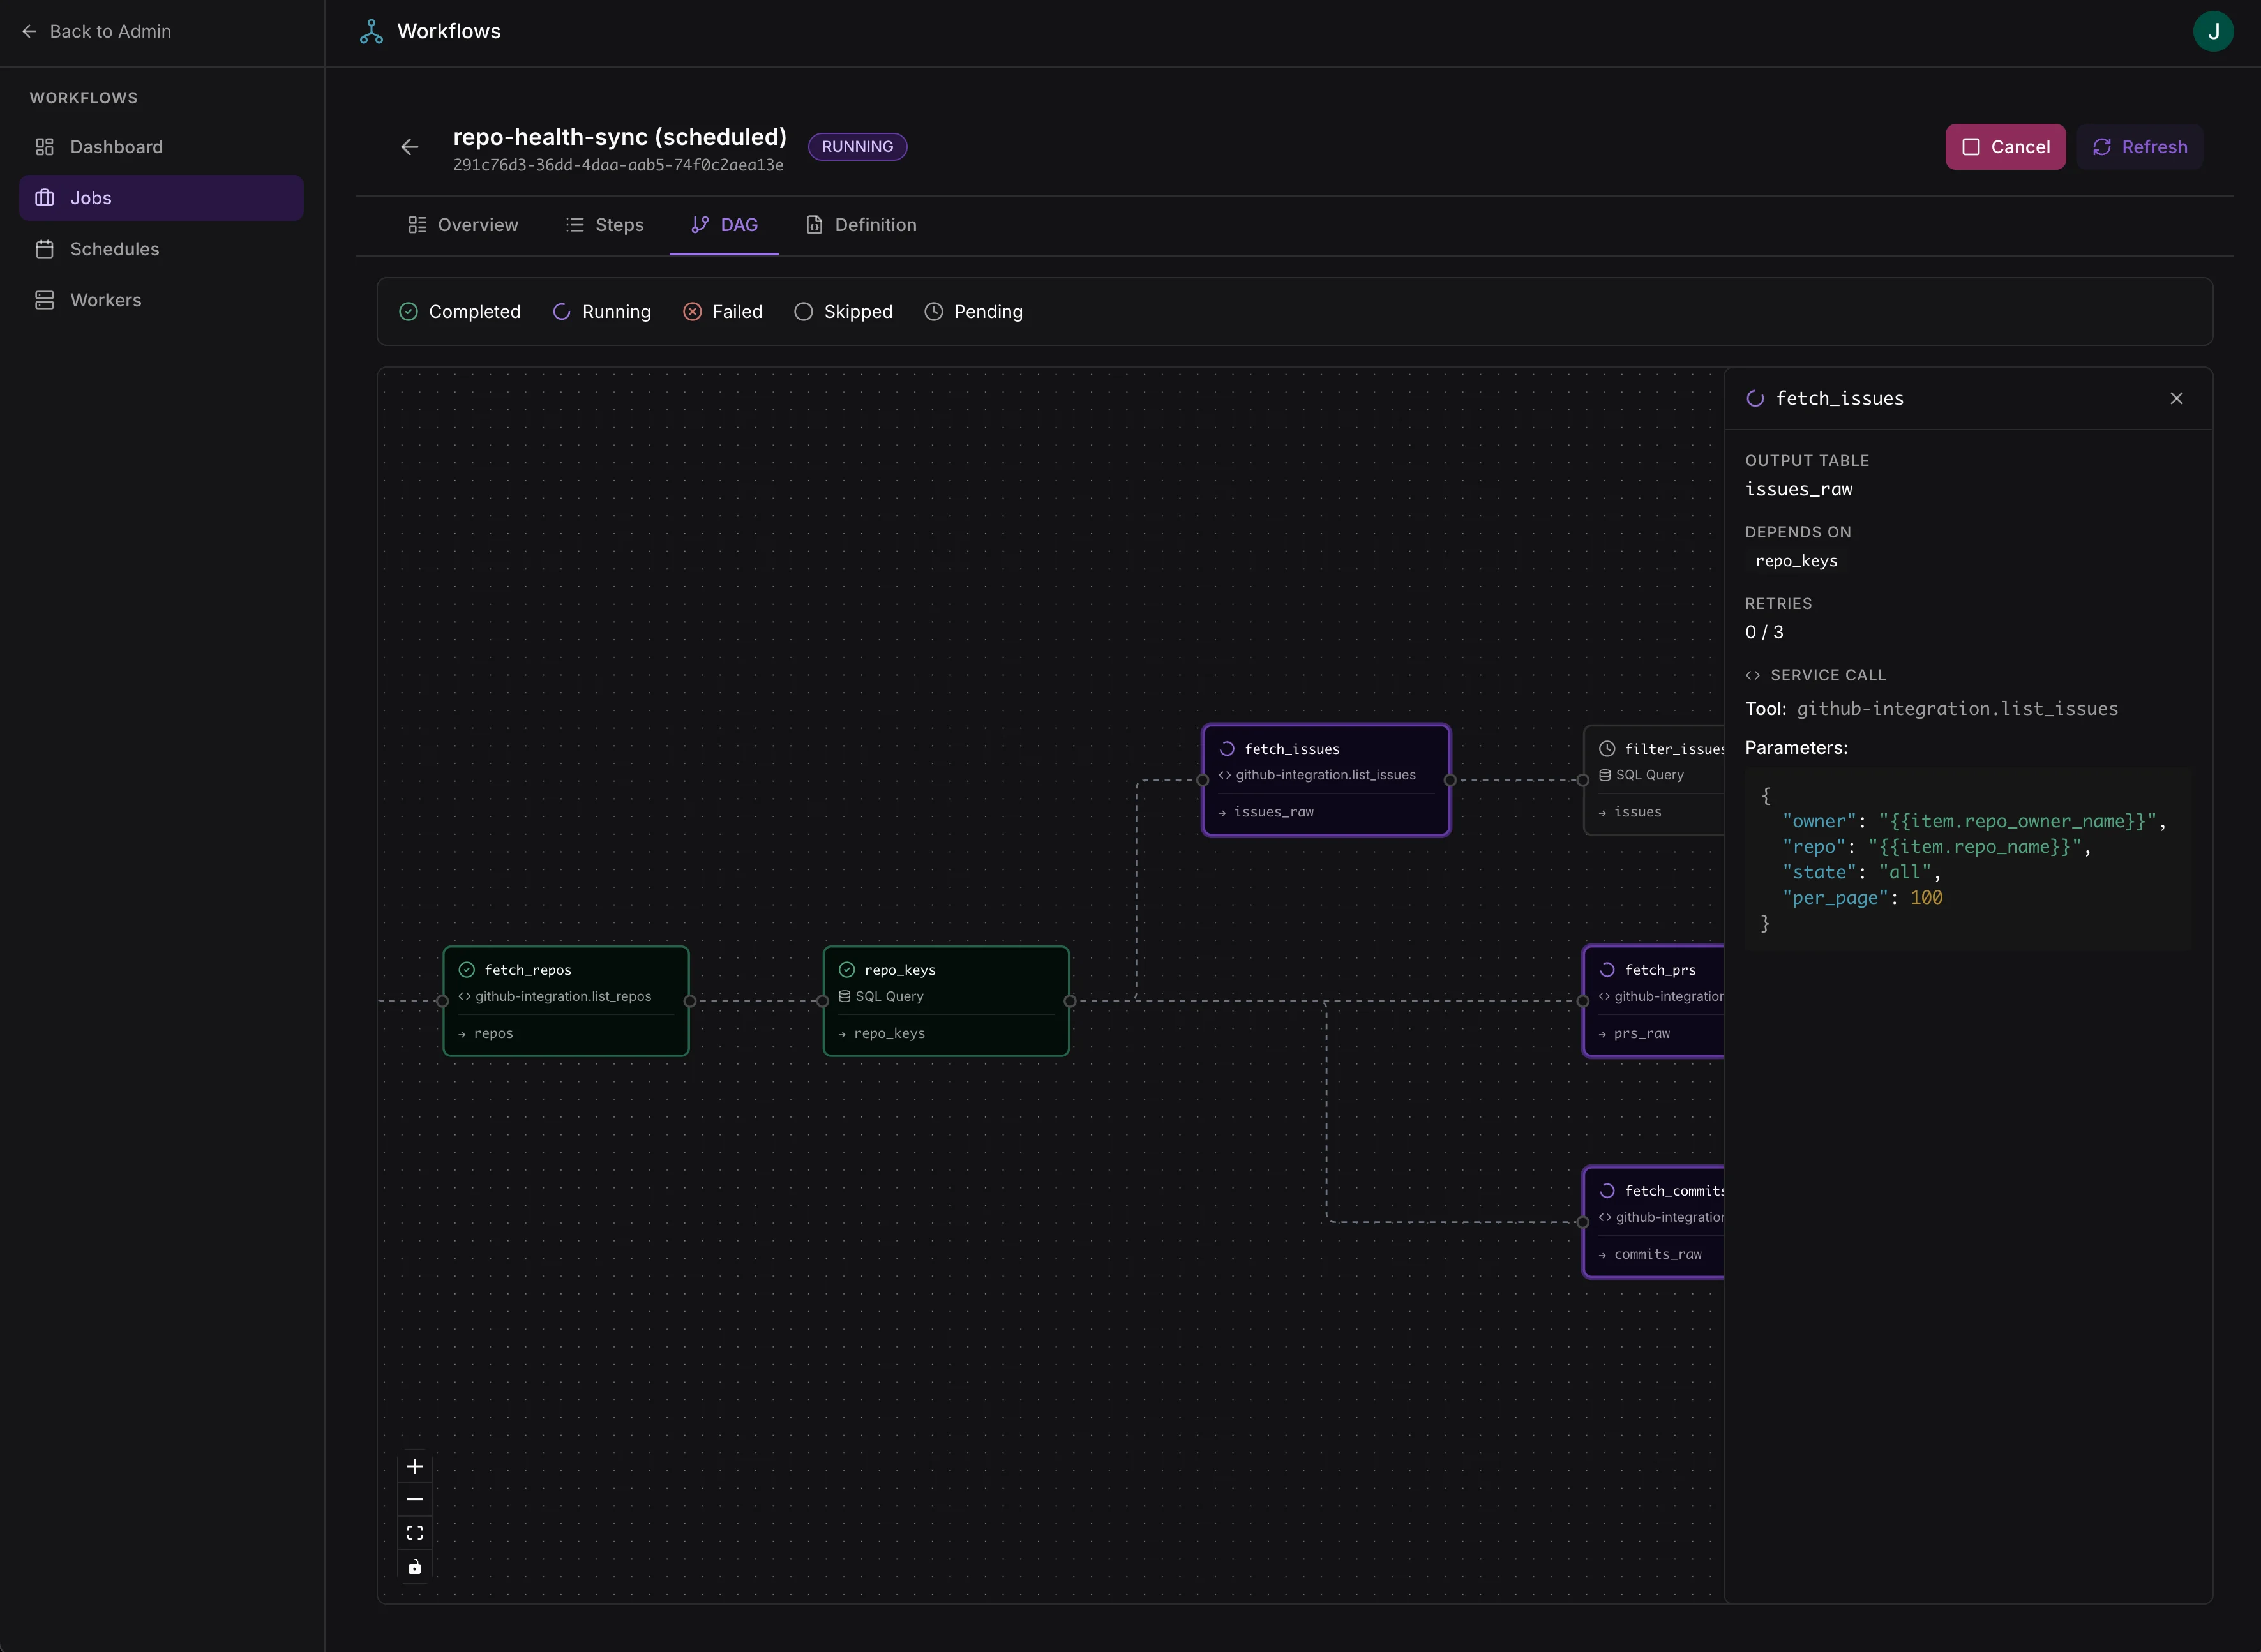
Workflow DAG view with realtime step-by-step progress and step details
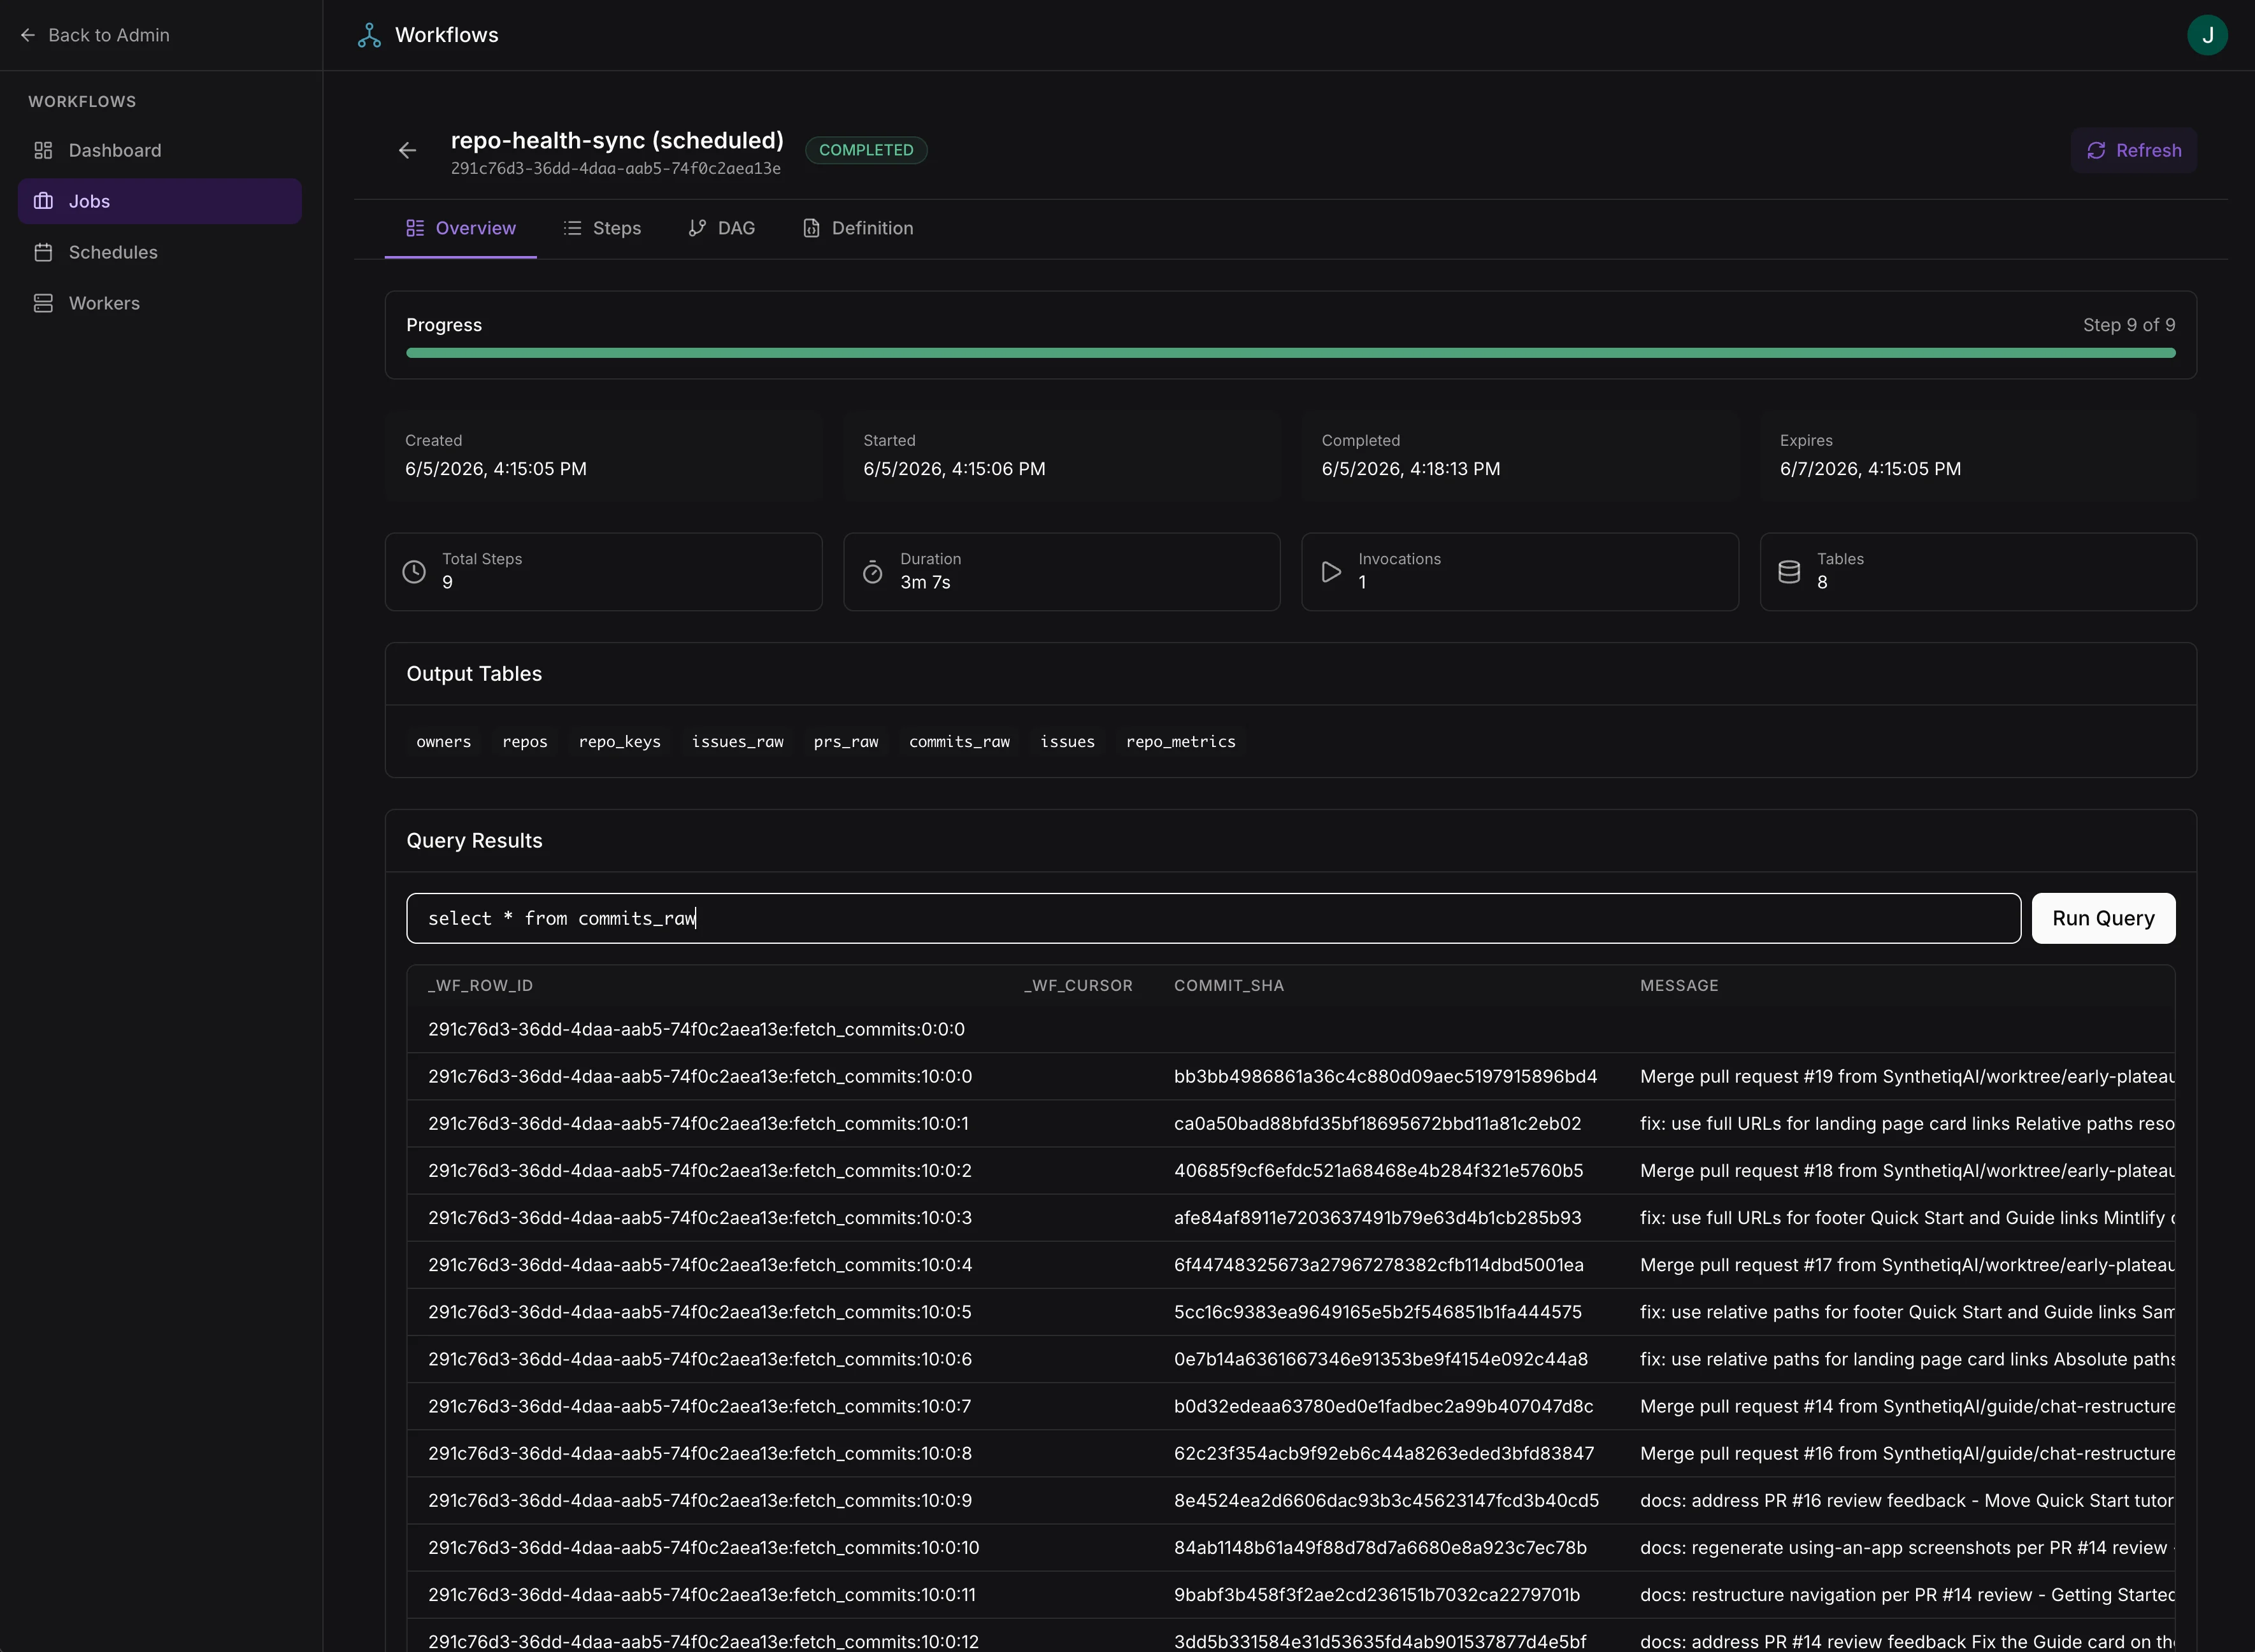
Exploring individual step results for debugging and introspection
Schedules
- View and manage scheduled workflows
- Enable/disable schedules, modify cron expressions
- Track last run and next run timestamps
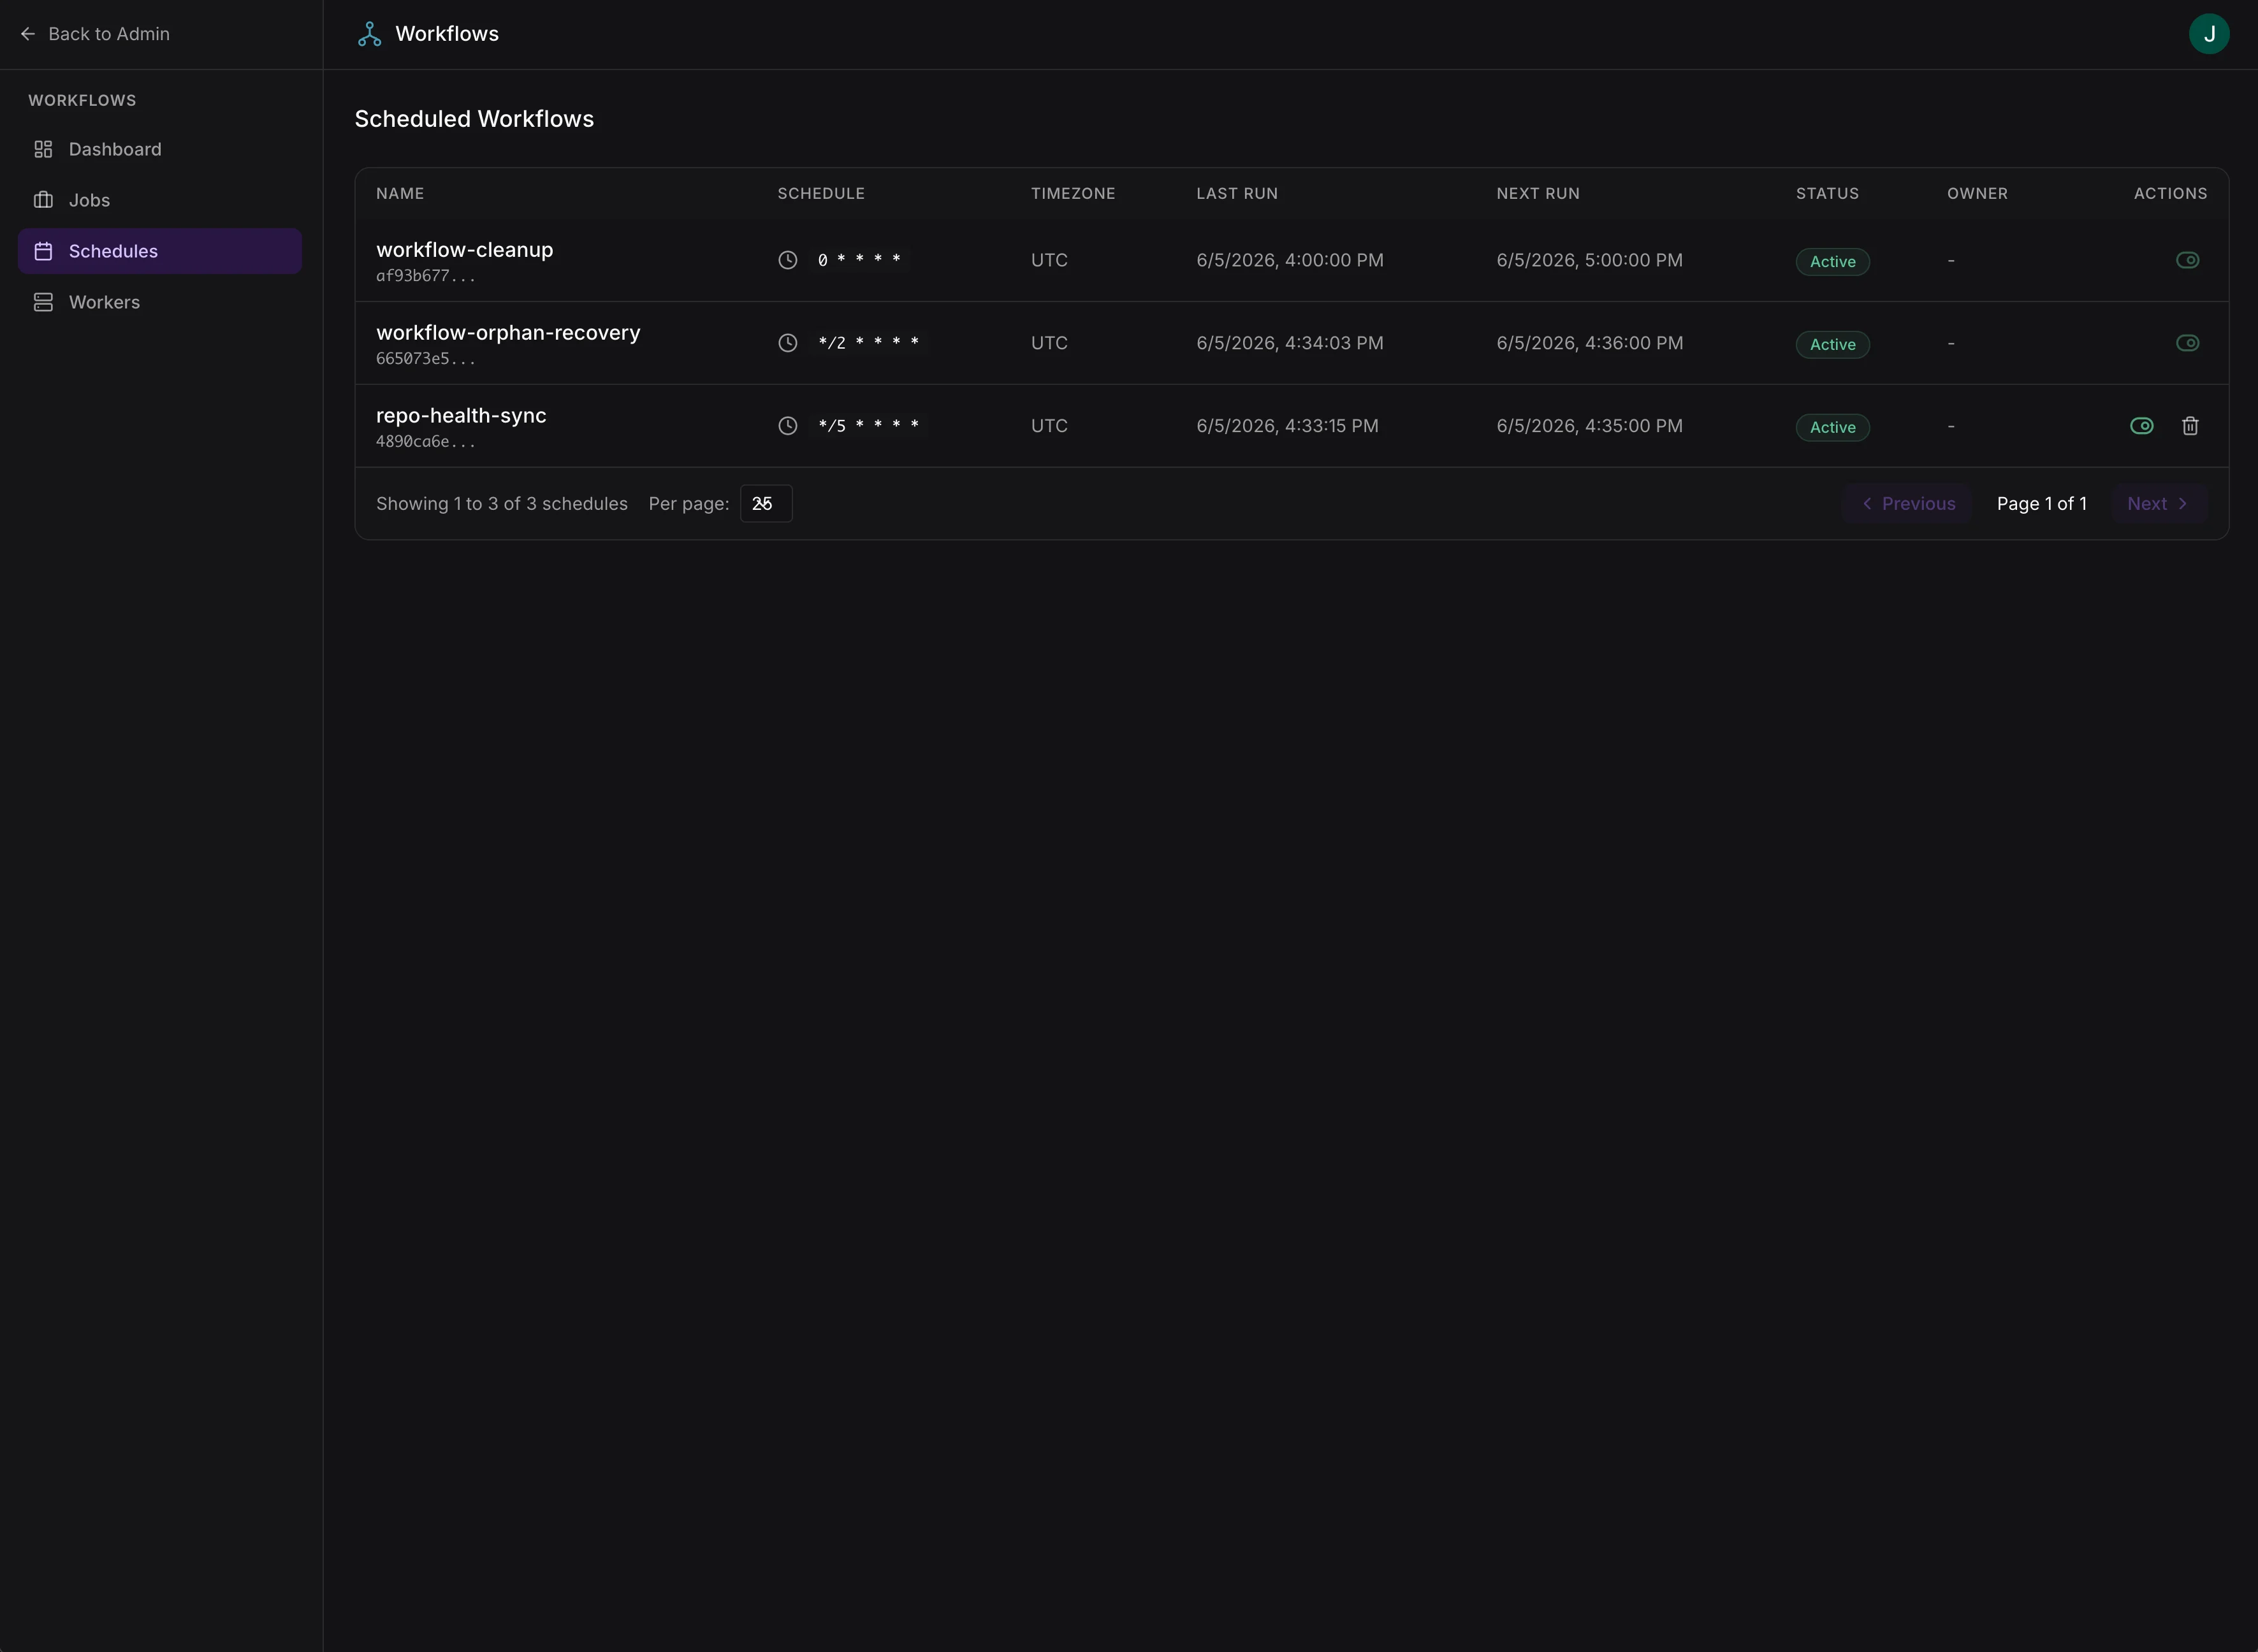
Schedule management with cron configuration and run tracking
Workers
- View active worker instances and their capacity
- Monitor worker heartbeats
- See which jobs are assigned to each worker
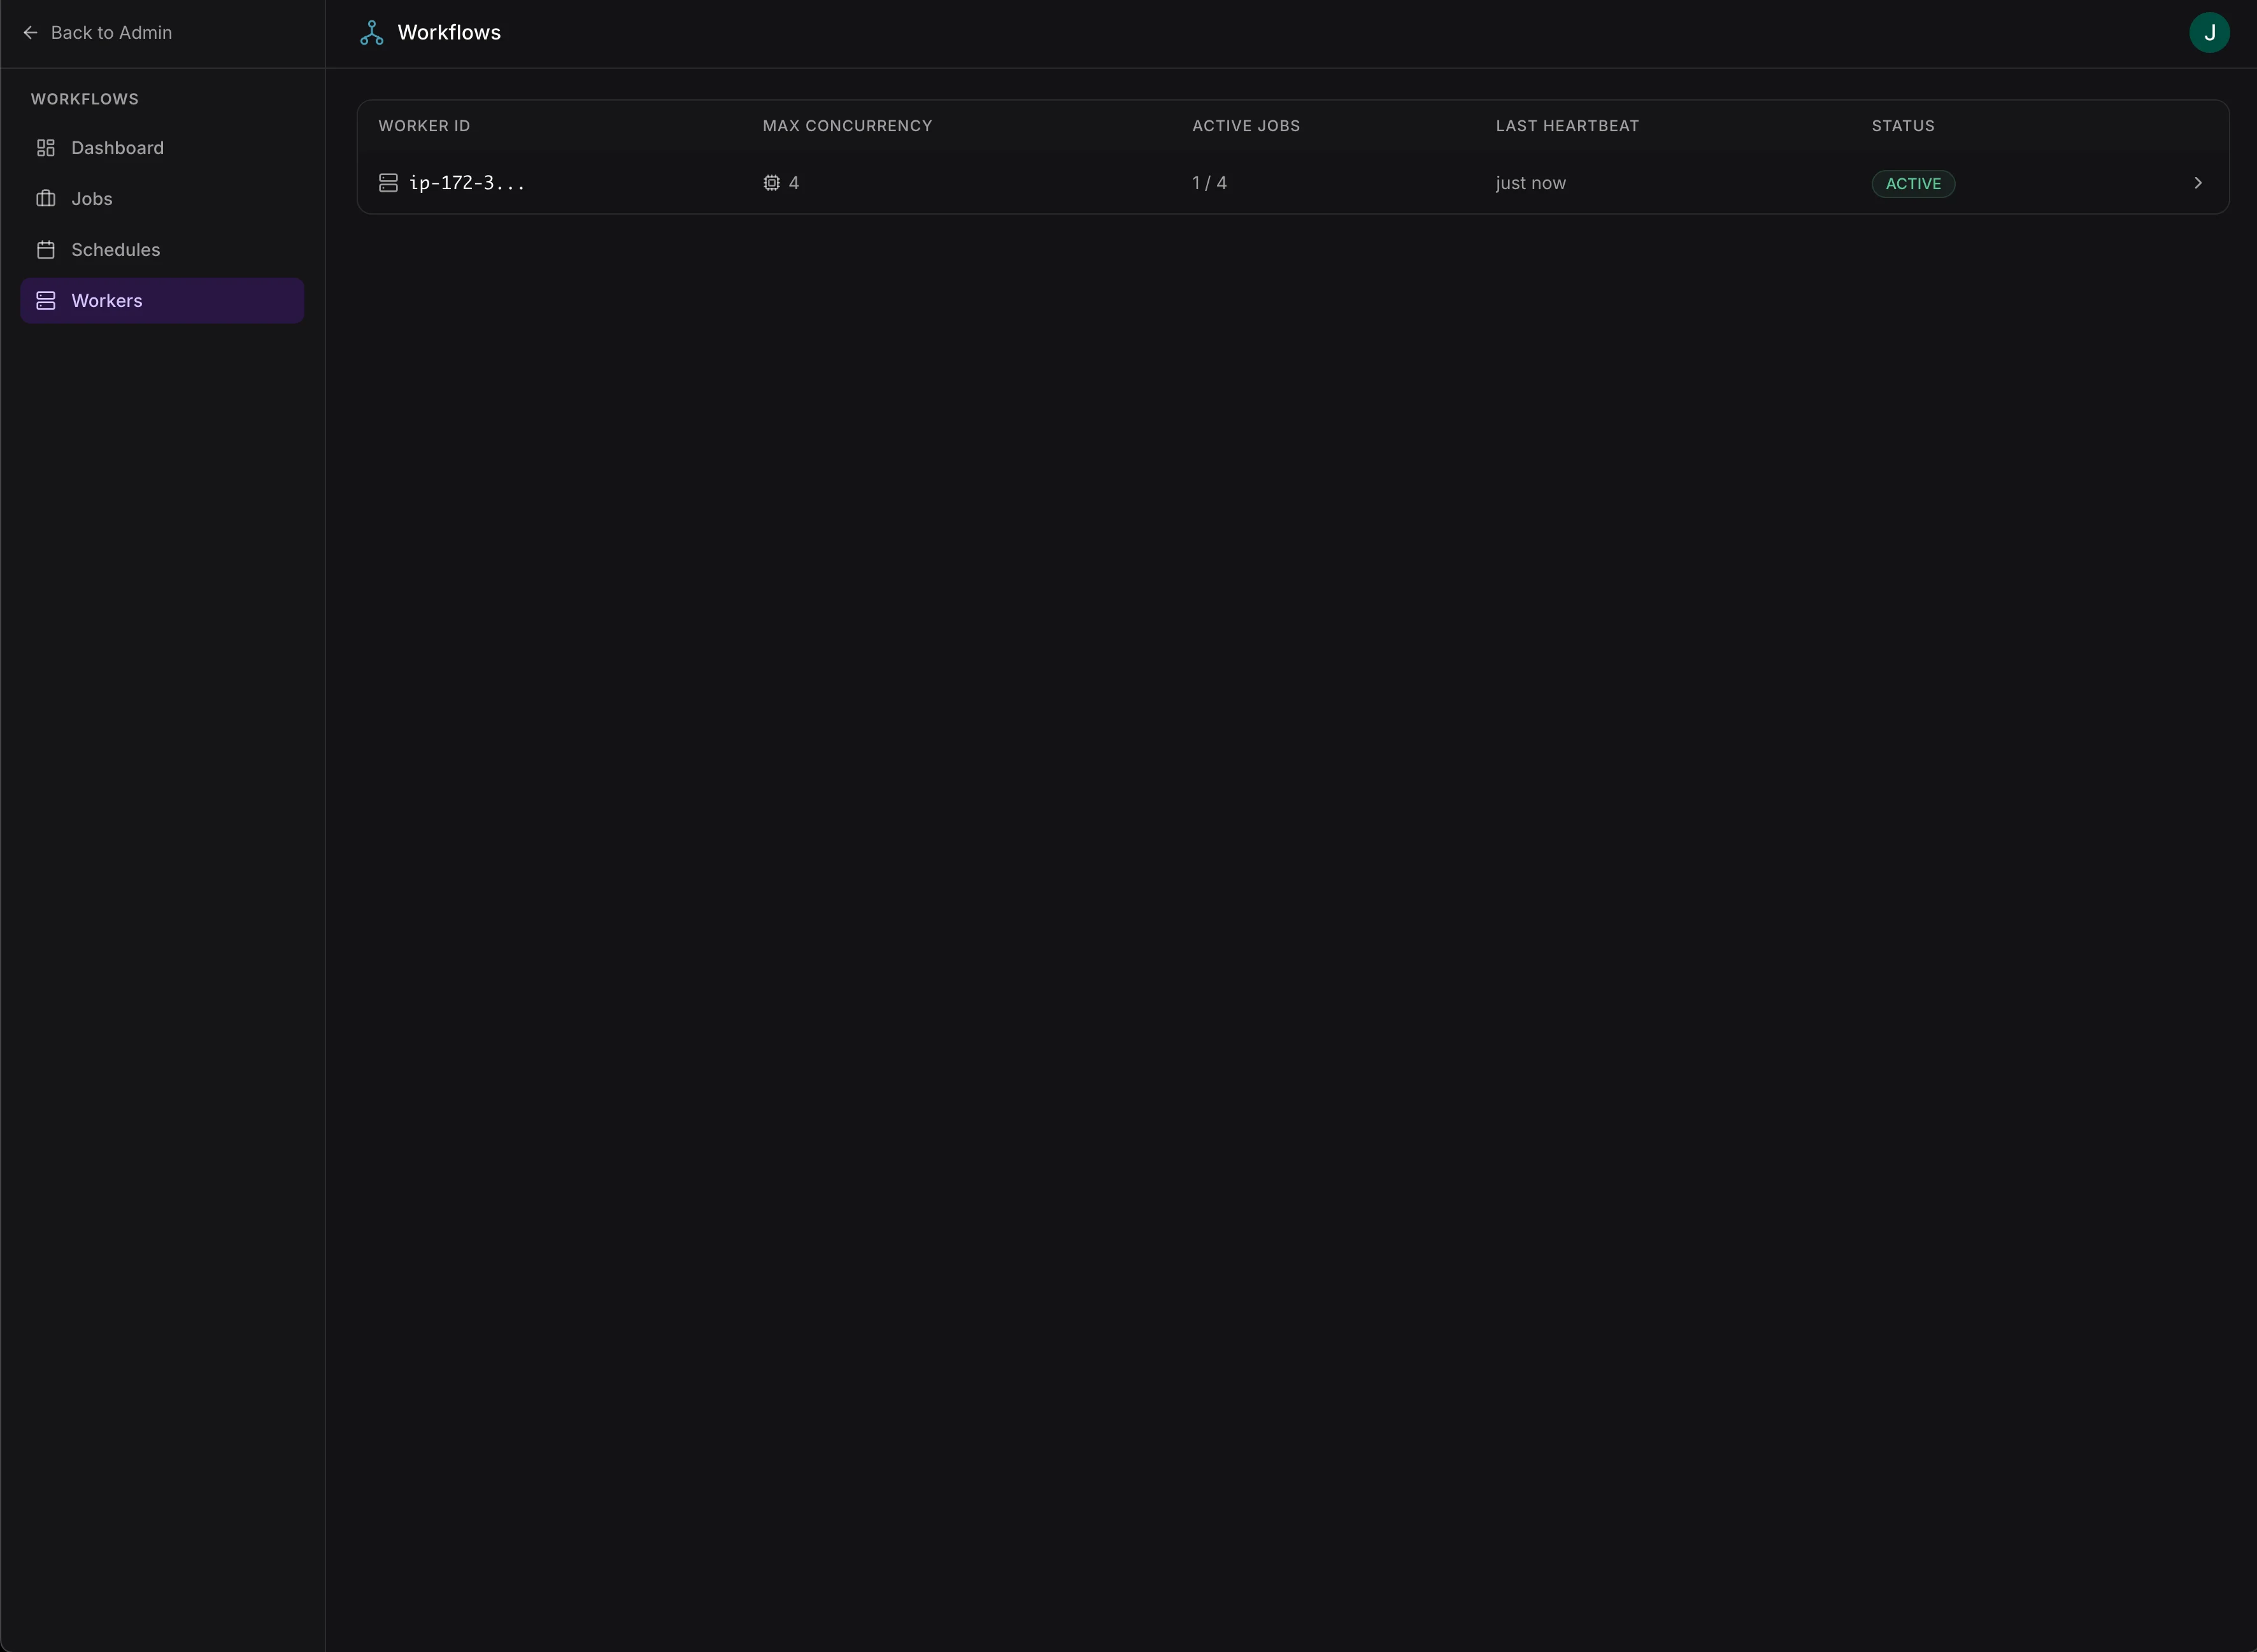
Active worker instances with concurrency, active jobs, and heartbeat status
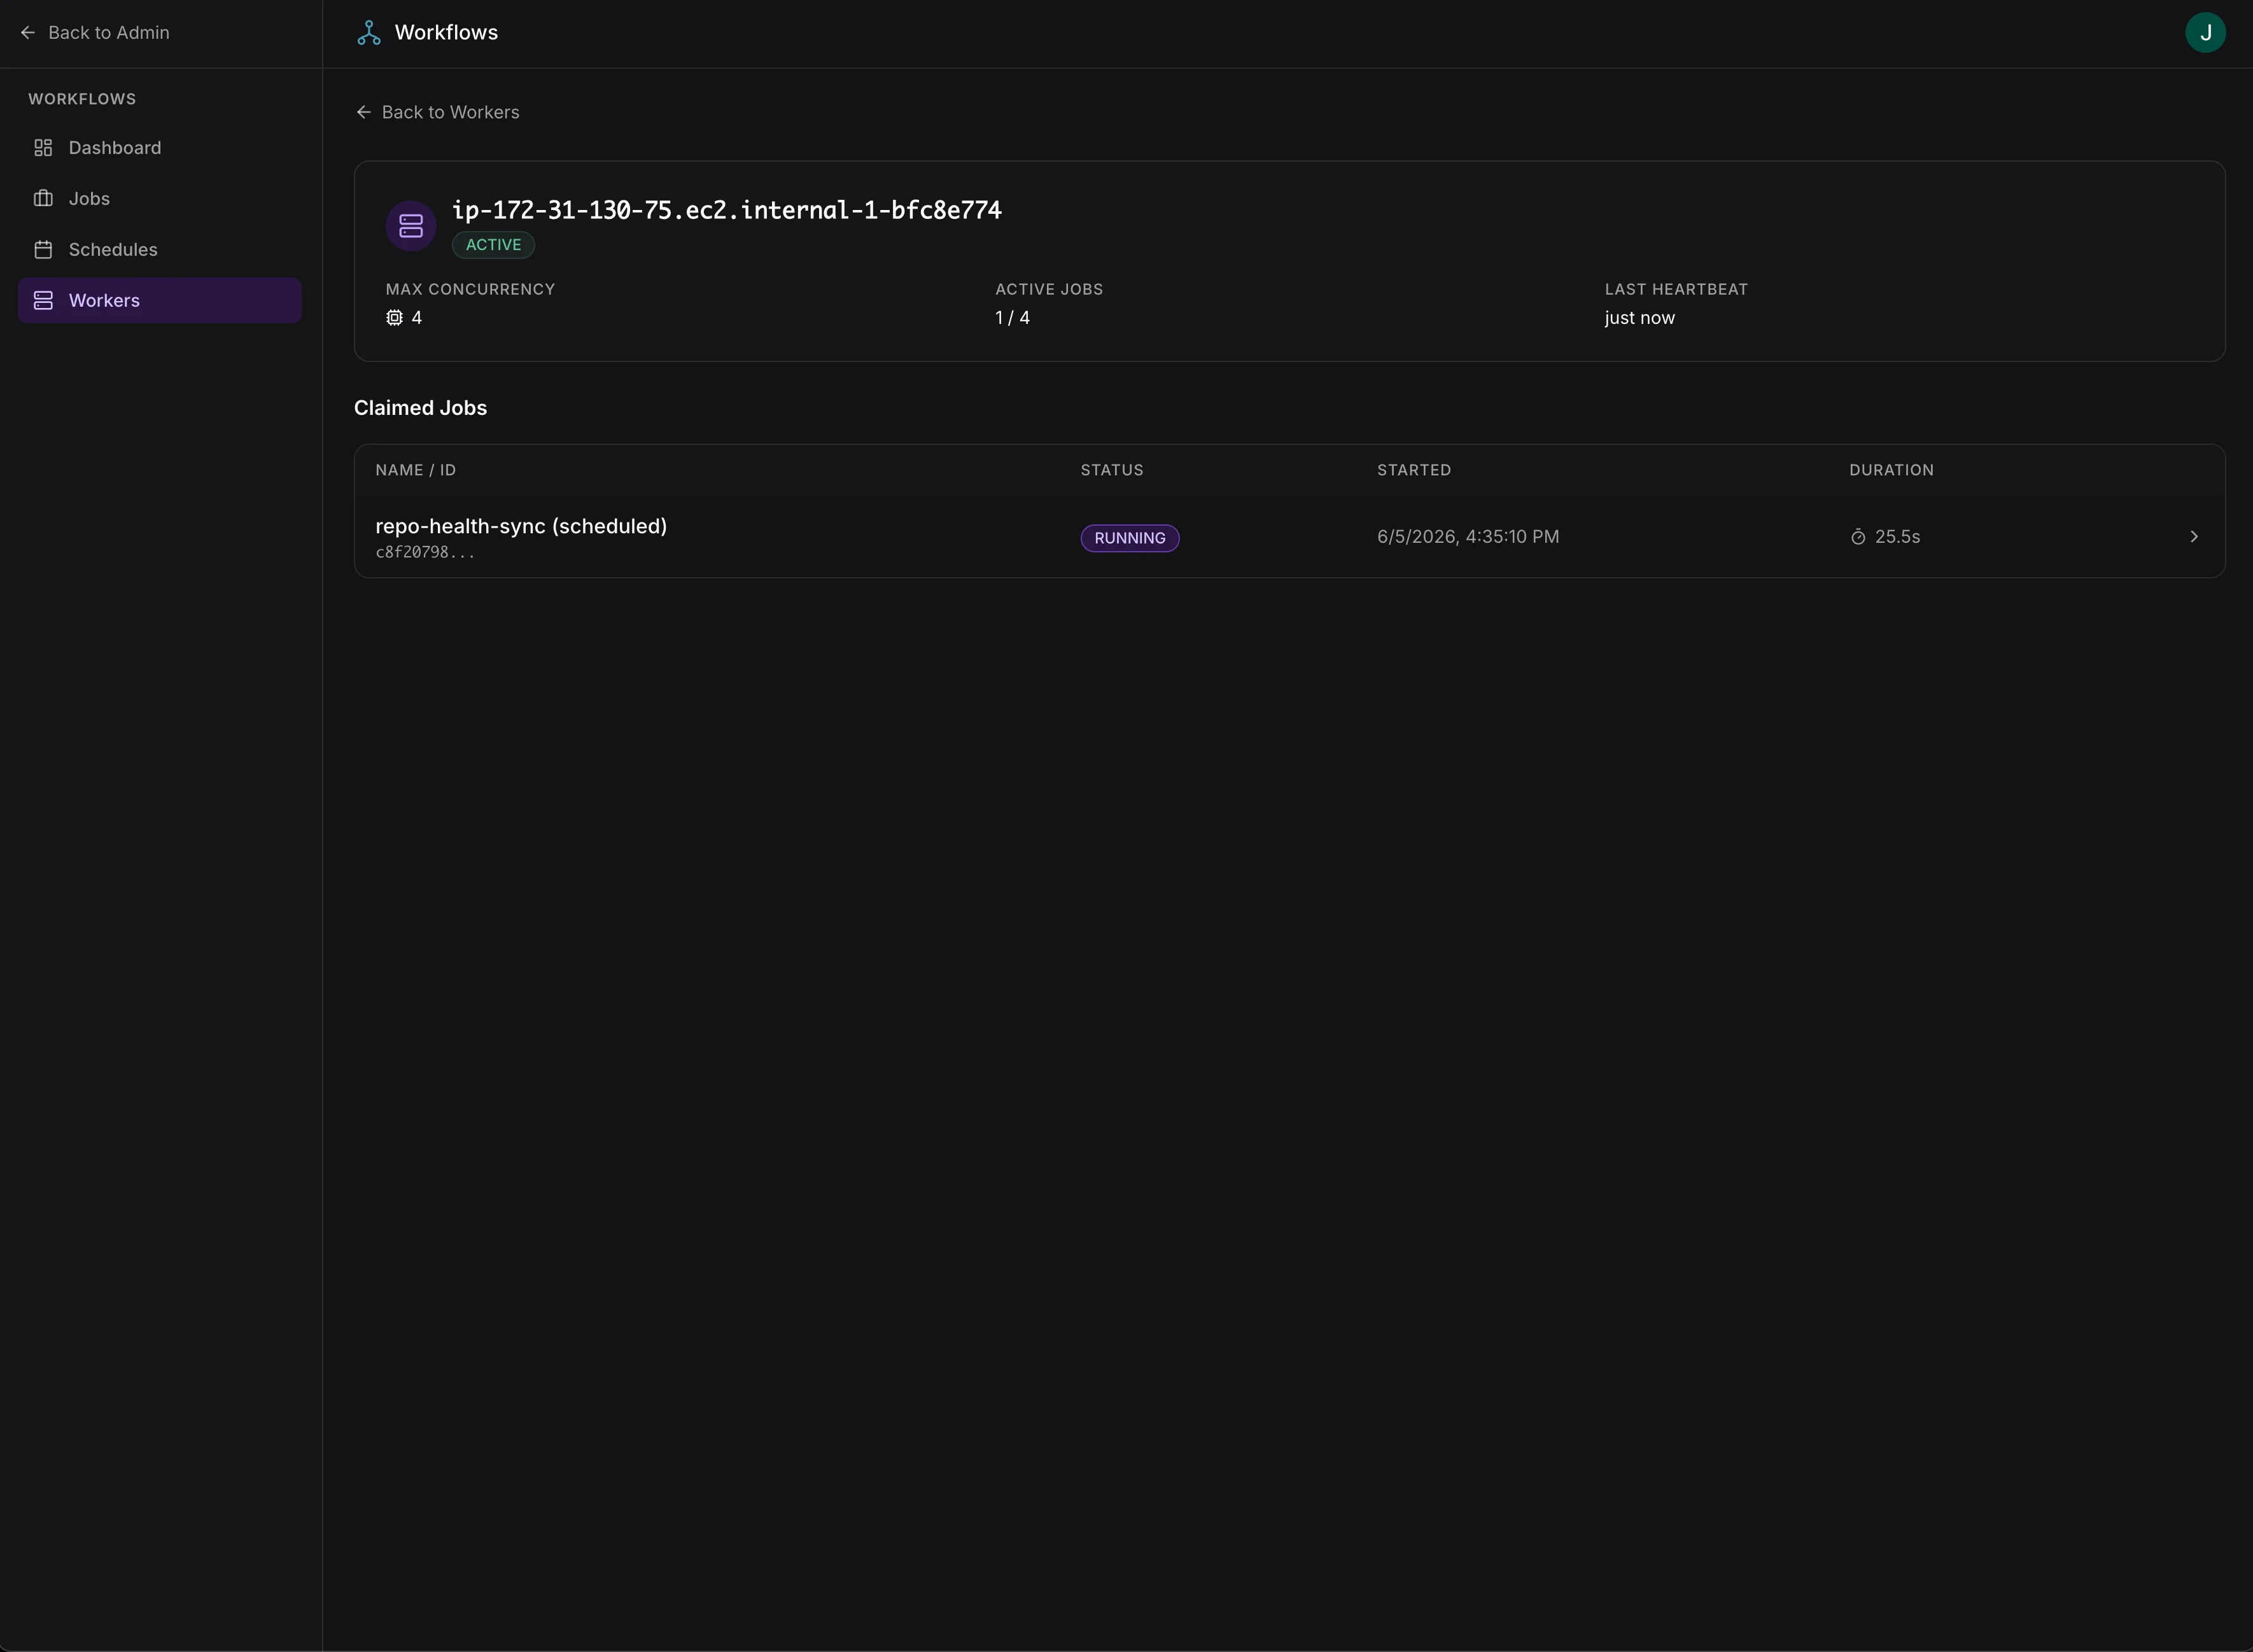
Worker detail view with claimed jobs and real-time capacity