
Structured logging

All application logging uses structured JSON. Each log entry includes:
FieldDescription
sourceapp or worker
typeEvent type (e.g., http_request, service_call, workflow_step)
statusHTTP status code
msResponse latency in milliseconds
userIdAuthenticated user ID (when applicable)
traceIdRequest trace identifier
errorError message (when applicable)
Logs are isolated per app — each app writes to its own log stream. Apps can also instrument custom log fields to capture application-specific data (see Custom Logging guide). A structured log search interface is available at:
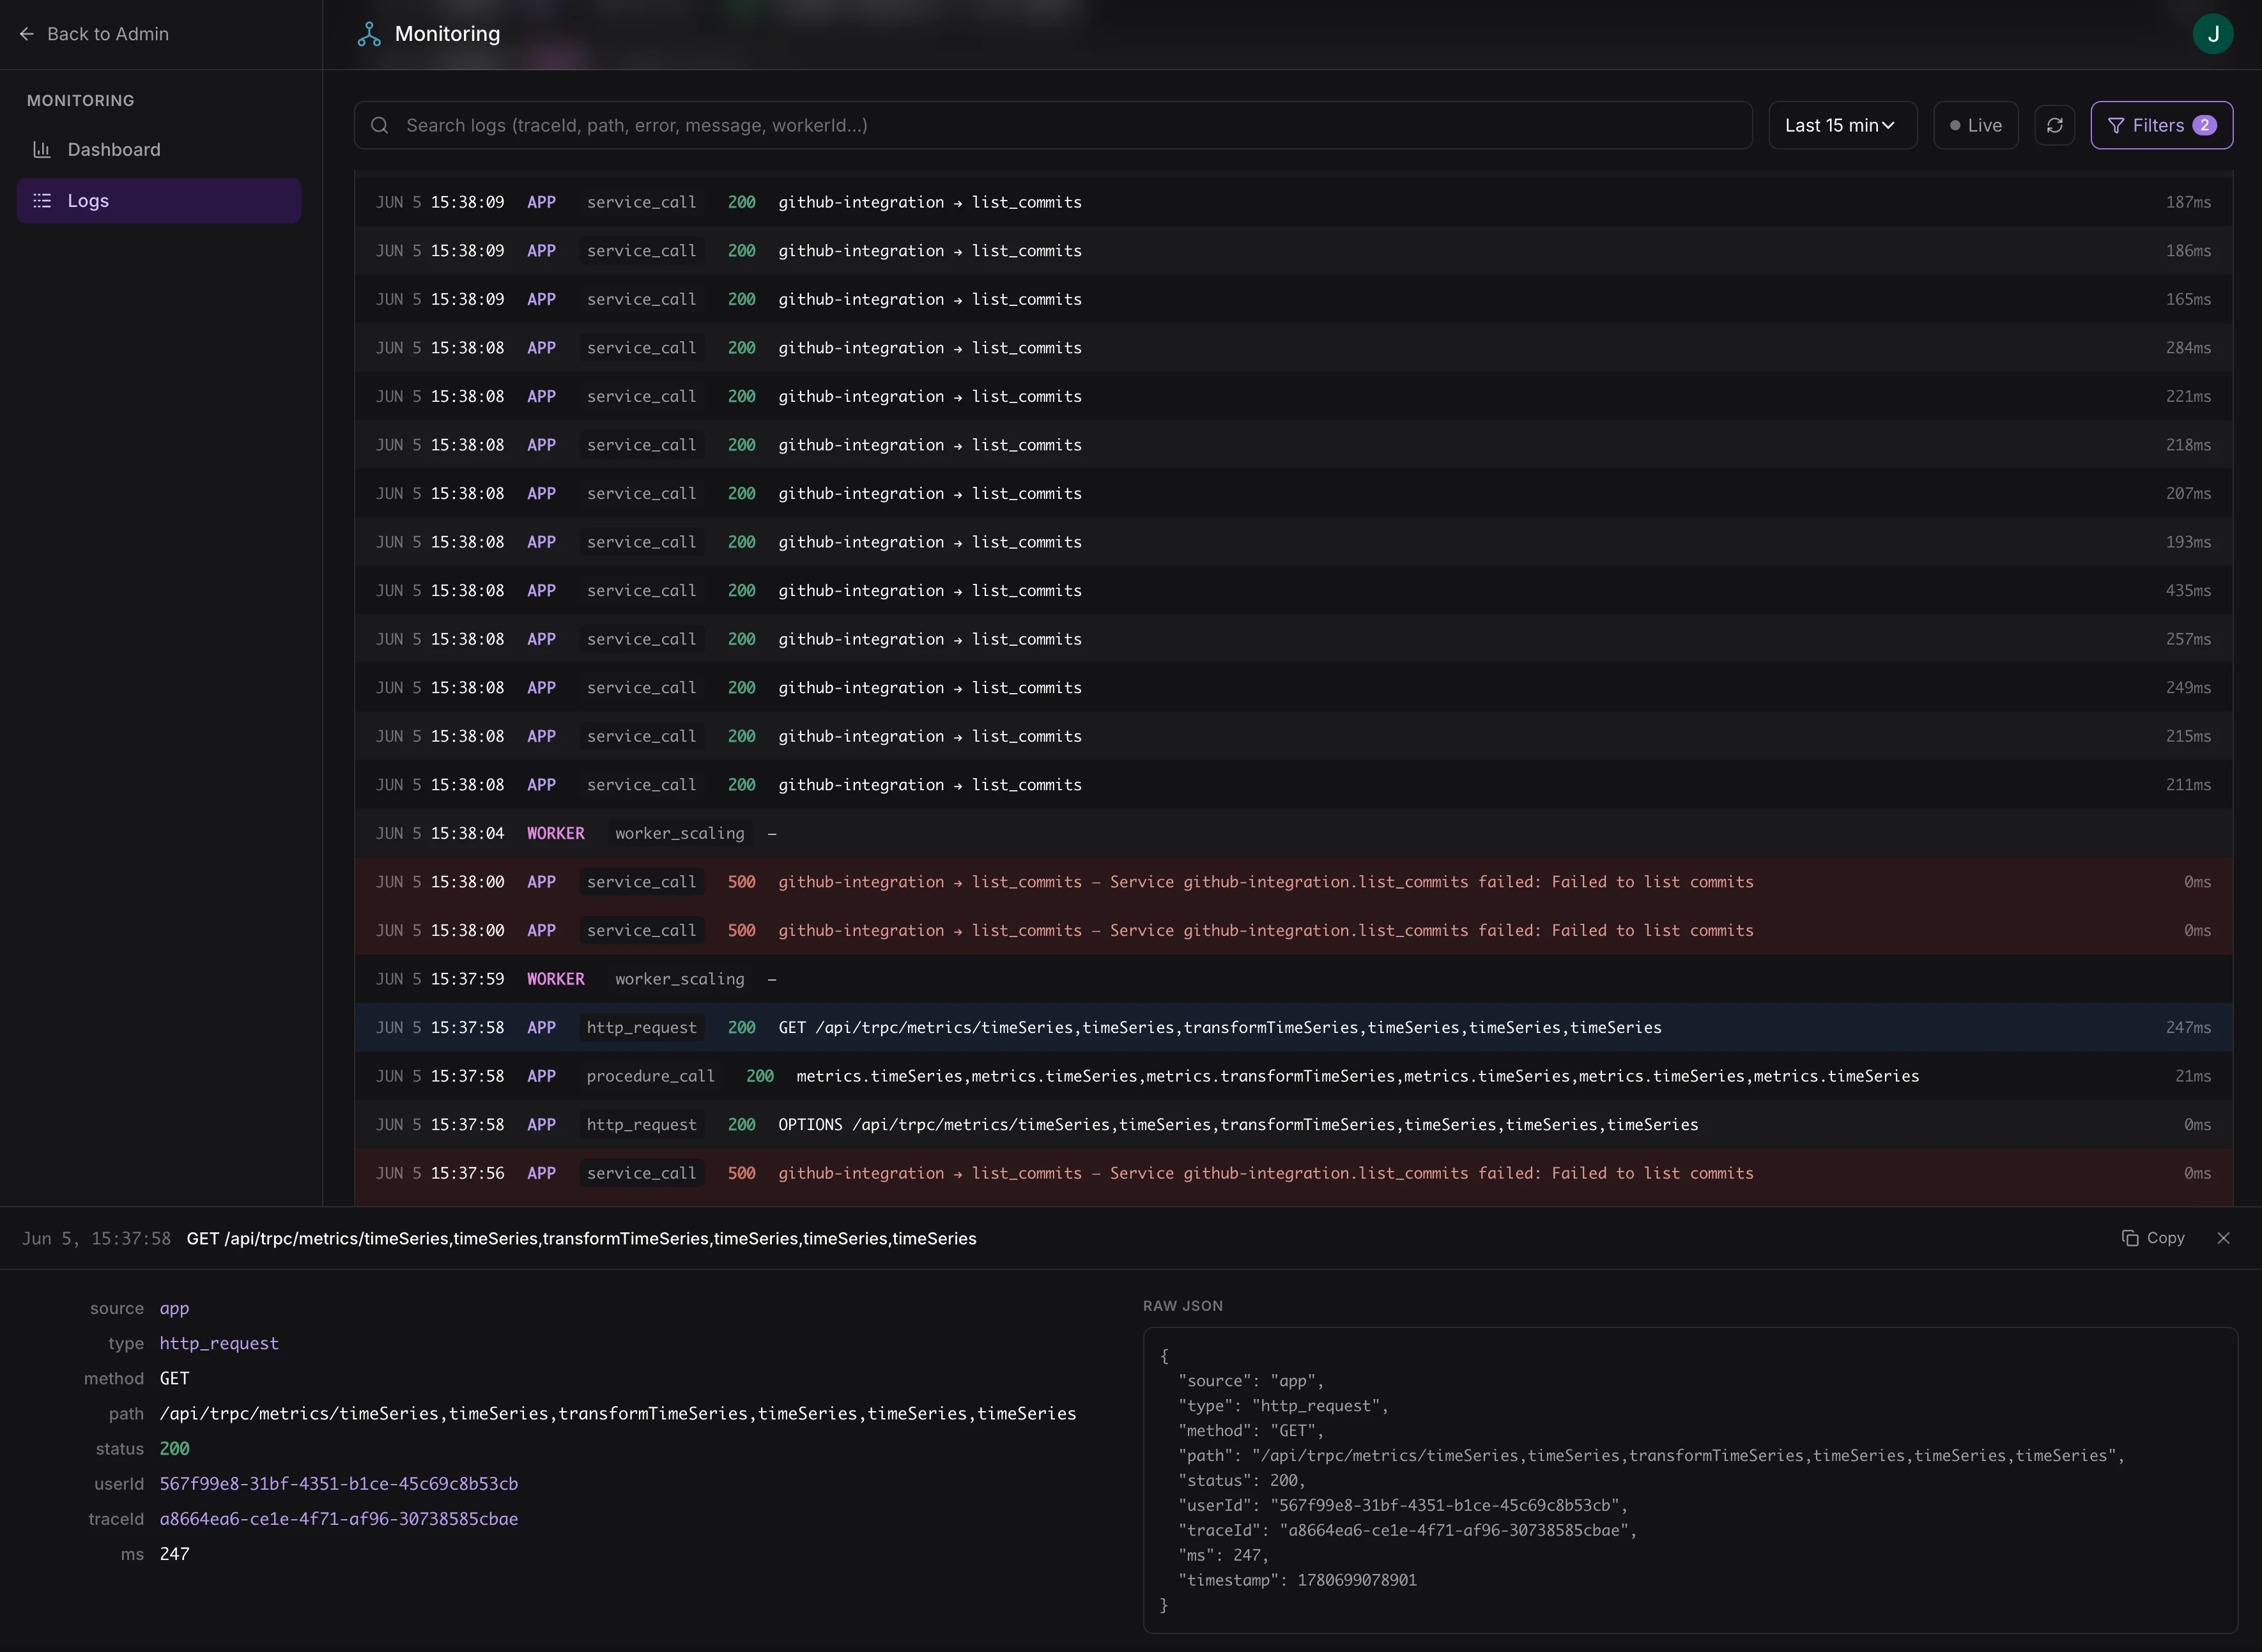
https://{your-app-url}/admin/monitoring/logs
Log search interface with structured filtering
Access requires the logs:view scope. Assign this scope to admin roles in your app’s access control configuration.

Filter options

FilterDescription
Sourceapp (HTTP server) or worker (workflow processor)
TypeRequest type, workflow step name, etc.
Status rangeFilter by HTTP status code range (e.g., 500–599 for errors)
User IDFilter to a specific user’s activity
Trace IDFollow a request across services
Full-text searchSearch across all log entry fields
Time rangeCustom start and end timestamps
Logs are available in near-real-time, typically within a few seconds.