Build Failure to Root Cause in 30 Seconds
Build AI-powered visibility into your cloud infrastructure on Synthetiq. Ask questions, build dashboards, and automate monitoring across AWS, Vercel, and any provider. Engineers, finance, and security all use the same tool.
Six Consoles. Twelve Dashboards. Zero Answers.
AWS Cost Explorer requires training. Vercel shows deployments but not why they failed. IAM policies are reviewed manually, making it hard to keep up with the pace of change. Environment variables drift between staging and production. DevOps teams juggle multiple consoles throughout the day, each answering only part of the picture.

What Teams Build
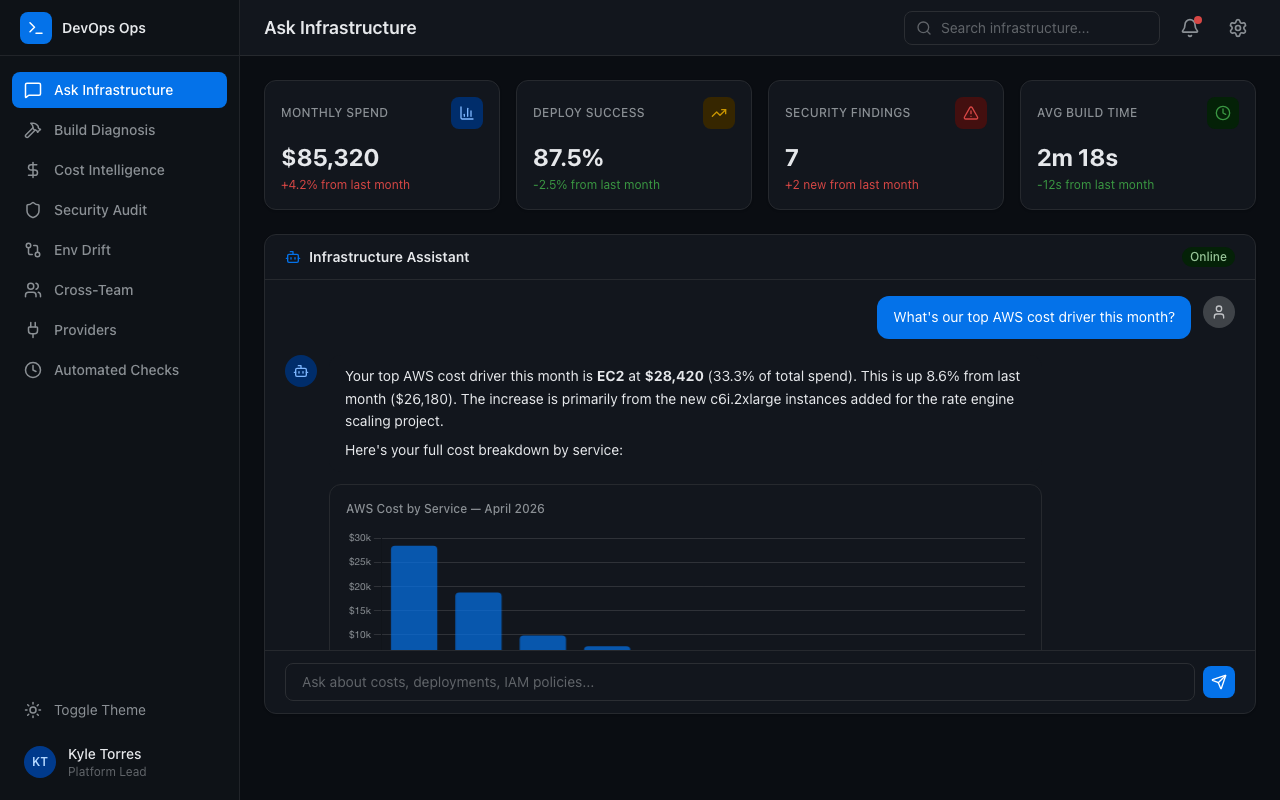
Ask, Don't Navigate
"What's our top AWS cost driver this month?" "Which builds failed today and why?" "Show IAM roles with wildcard permissions." Natural language to API calls to visualized answers. Pin answers to dashboards or keep exploring.
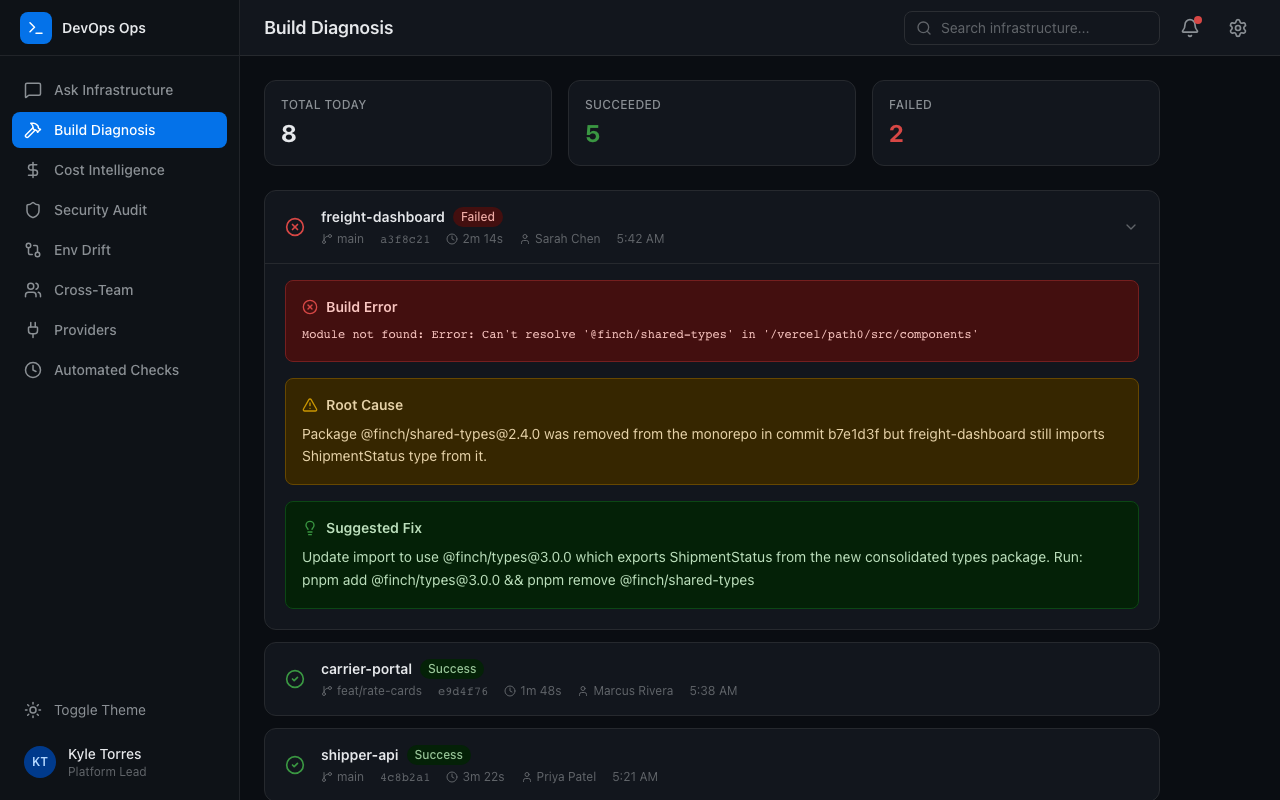
Build Failure Diagnosis
Deployment fails. The AI reads the build logs, identifies the root cause, and suggests a fix. From red build to root cause in seconds, not 30 minutes of scrolling through stderr.
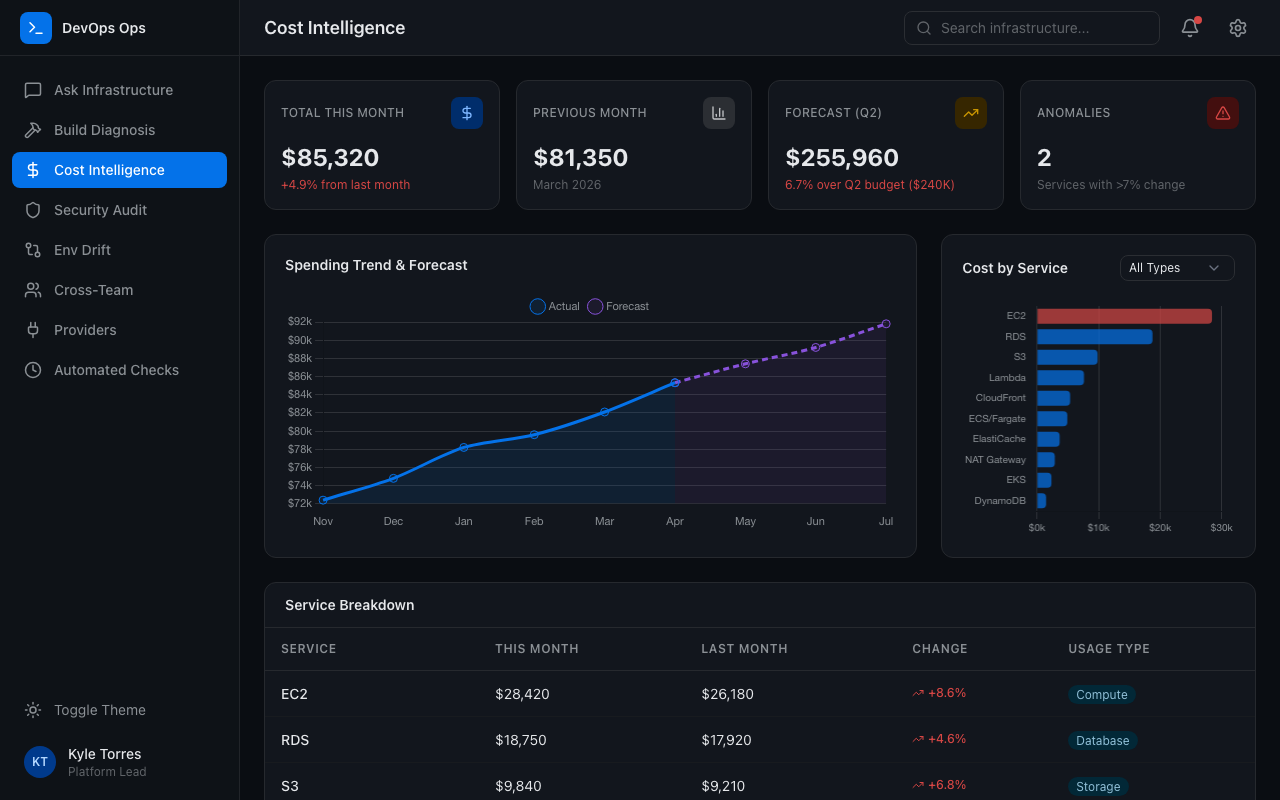
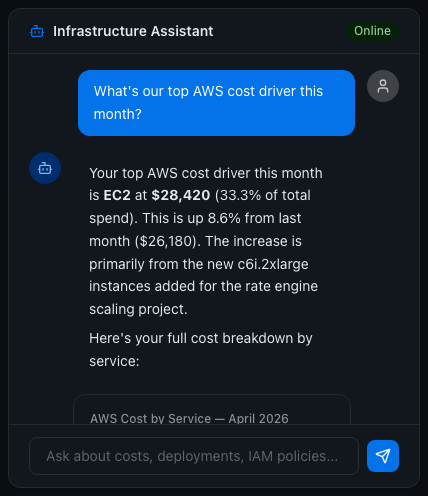
Cost Intelligence
Break down spending by service, date, usage type, or tag. Compare months. Spot anomalies. Get AI-generated forecasts. Alert before budgets are exceeded, not after the bill arrives.
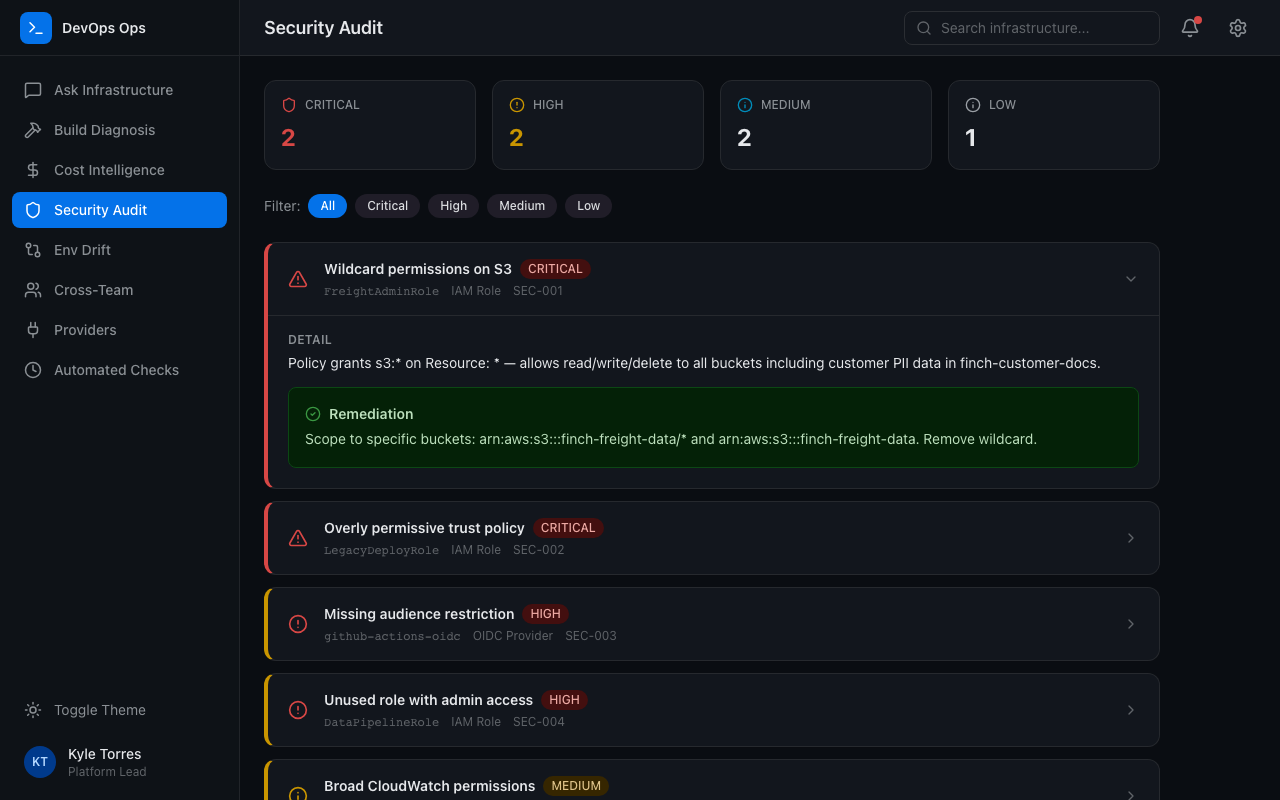
Continuous Security Auditing
IAM roles, trust policies, OIDC providers, overly permissive configurations: reviewed continuously, not quarterly. The AI flags issues and suggests remediation proactively.
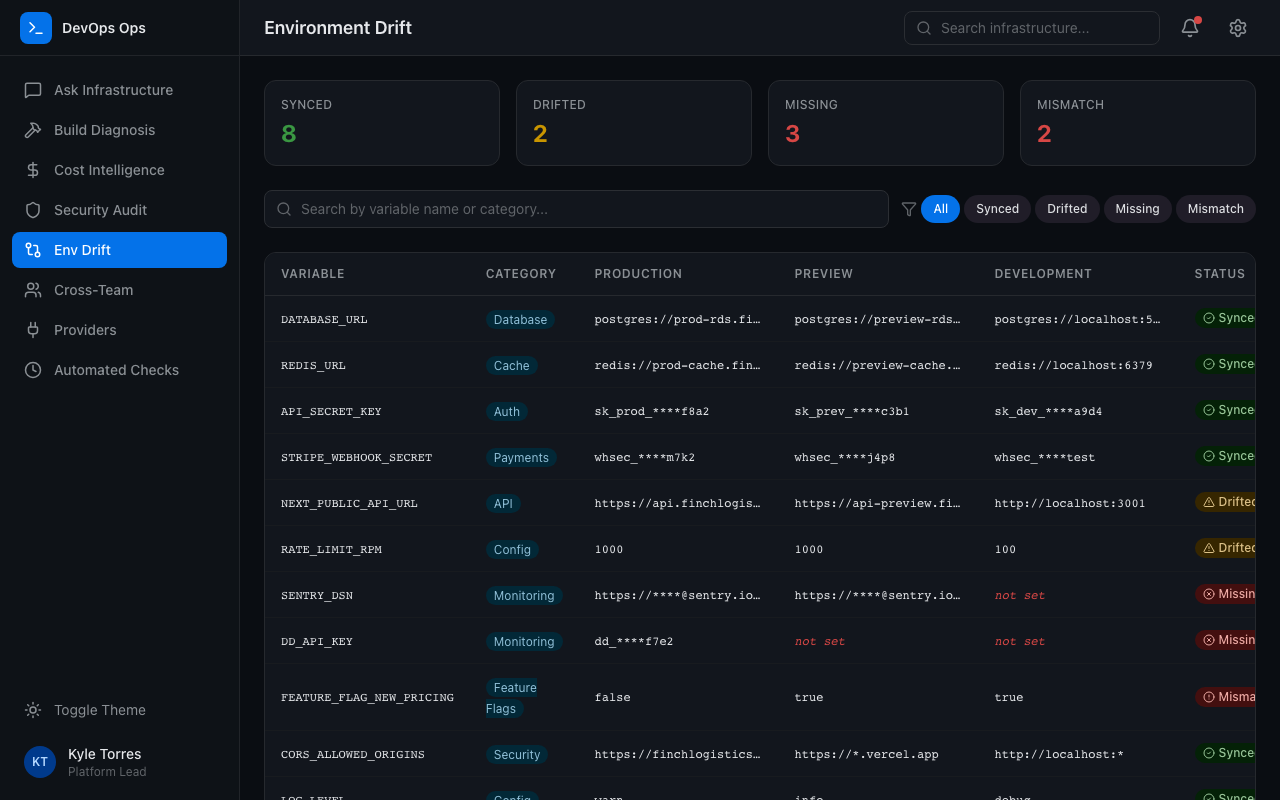
Environment Drift Detection
Compare env vars across production, preview, and development. Spot configuration drift. Verify DNS. Catch misconfigurations before they cause incidents.
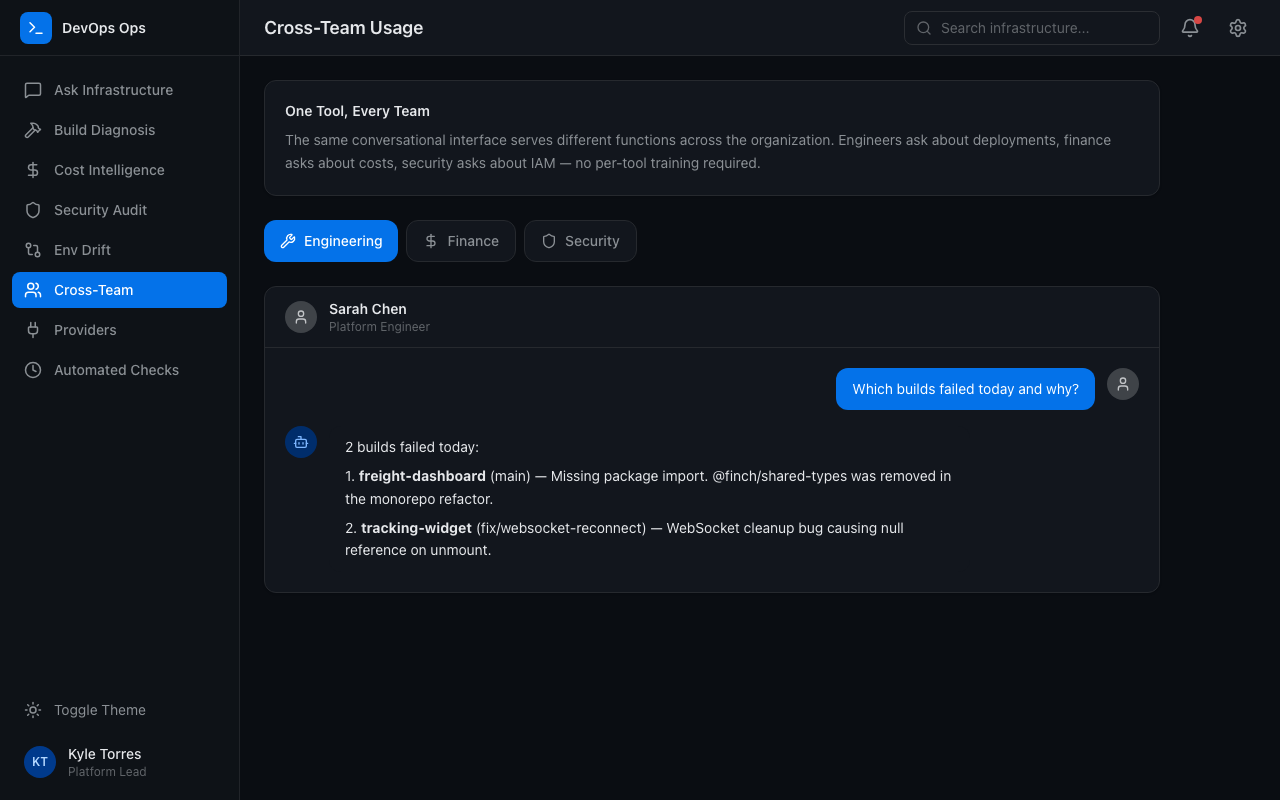
One Tool for Every Function
Engineers ask about deployments. Finance asks about costs. Security asks about IAM. Same tool, same dashboards, different questions. One tool, one license, every team.
What Teams Build
Ask, Don't Navigate
"What's our top AWS cost driver this month?" "Which builds failed today and why?" "Show IAM roles with wildcard permissions." Natural language to API calls to visualized answers. Pin answers to dashboards or keep exploring.
Build Failure Diagnosis
Deployment fails. The AI reads the build logs, identifies the root cause, and suggests a fix. From red build to root cause in seconds, not 30 minutes of scrolling through stderr.
Cost Intelligence
Break down spending by service, date, usage type, or tag. Compare months. Spot anomalies. Get AI-generated forecasts. Alert before budgets are exceeded, not after the bill arrives.
Continuous Security Auditing
IAM roles, trust policies, OIDC providers, overly permissive configurations: reviewed continuously, not quarterly. The AI flags issues and suggests remediation proactively.
Environment Drift Detection
Compare env vars across production, preview, and development. Spot configuration drift. Verify DNS. Catch misconfigurations before they cause incidents.
One Tool for Every Function
Engineers ask about deployments. Finance asks about costs. Security asks about IAM. Same tool, same dashboards, different questions. One tool, one license, every team.
Ask Your Infrastructure. Get an Answer.
Connect Your Providers
Add AWS credentials, Vercel tokens, or any cloud provider's auth. One-time setup. The AI handles pagination, rate limits, and API complexity.

Connect Your Providers
Add AWS credentials, Vercel tokens, or any cloud provider's auth. One-time setup. The AI handles pagination, rate limits, and API complexity.
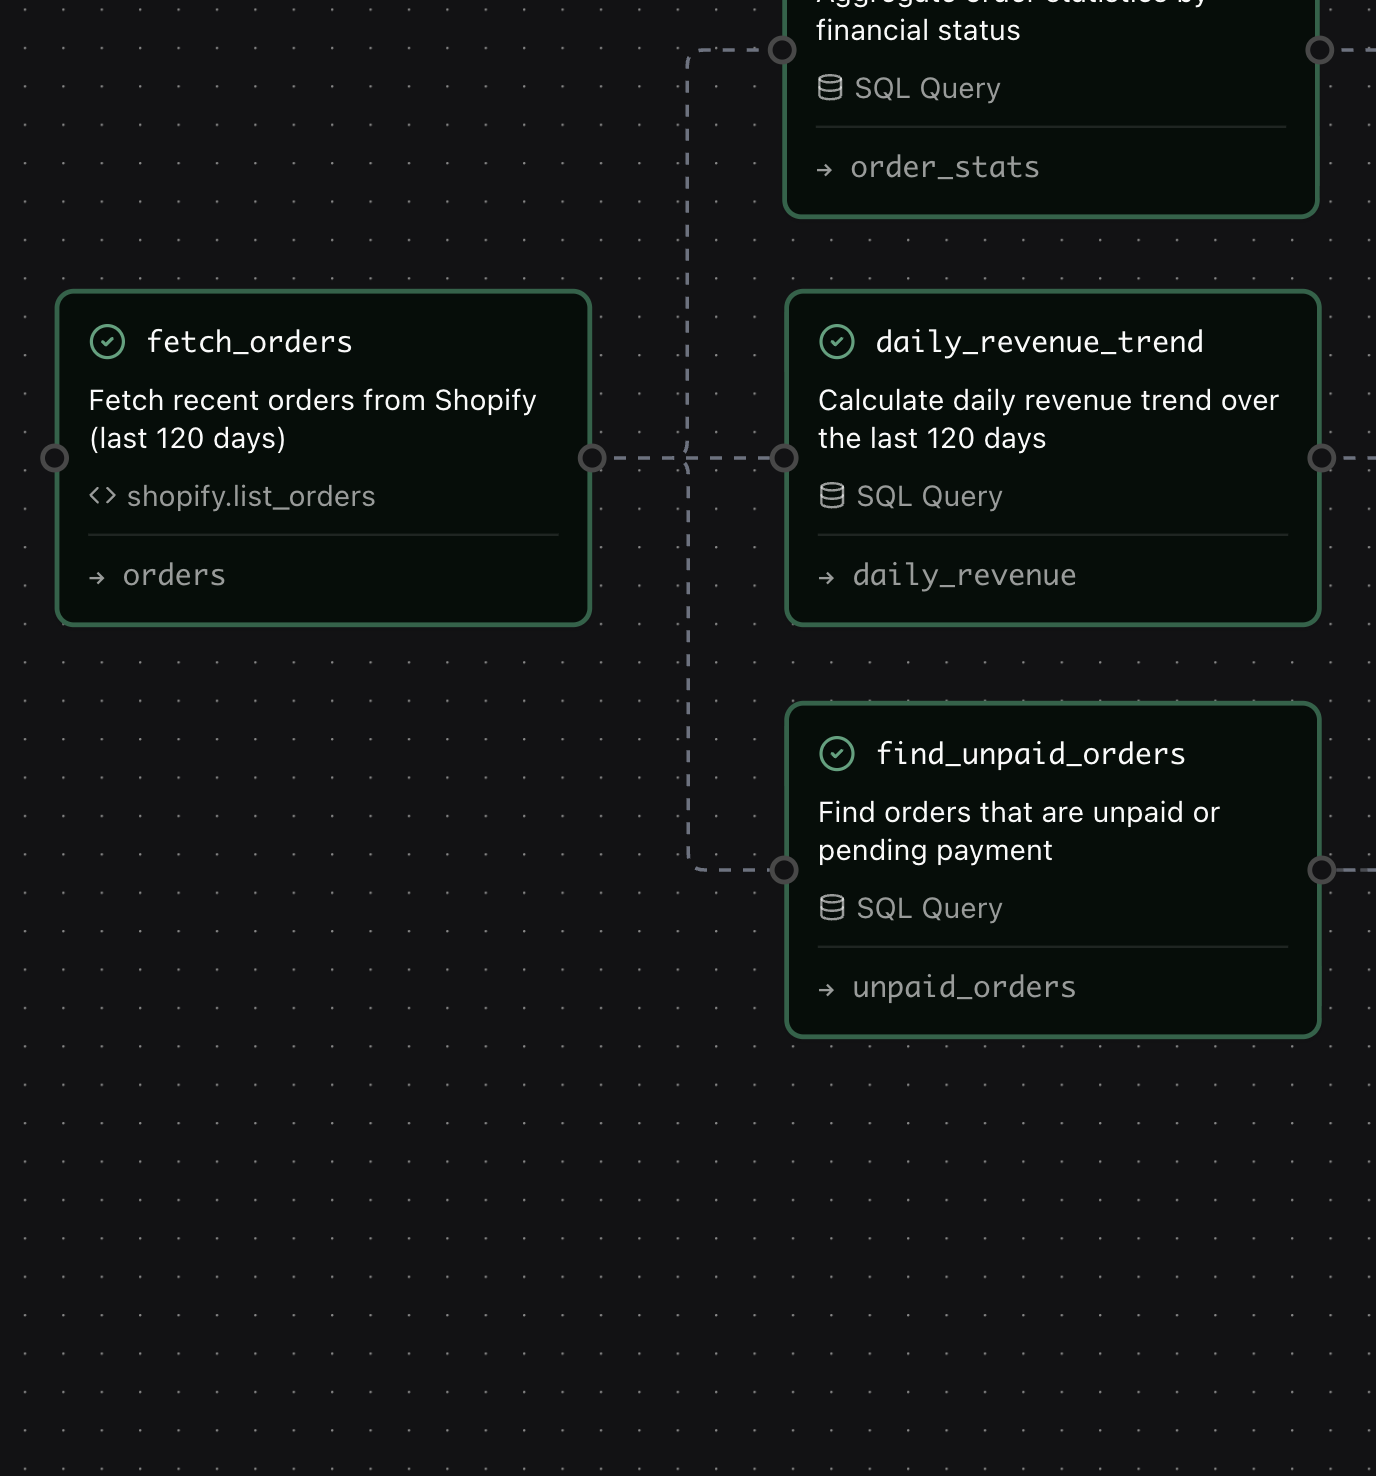
Ask in Plain Language
"What's our spend trending toward?" "Why did the last three deployments fail?" The AI calls the right APIs and returns the answer with charts.
Ask in Plain Language
"What's our spend trending toward?" "Why did the last three deployments fail?" The AI calls the right APIs and returns the answer with charts.
Automate the Checks
Schedule cost reports, security audits, and deployment health checks. Get alerted on thresholds, failures, or policy changes. Monitoring that runs itself.
Automate the Checks
Schedule cost reports, security audits, and deployment health checks. Get alerted on thresholds, failures, or policy changes. Monitoring that runs itself.
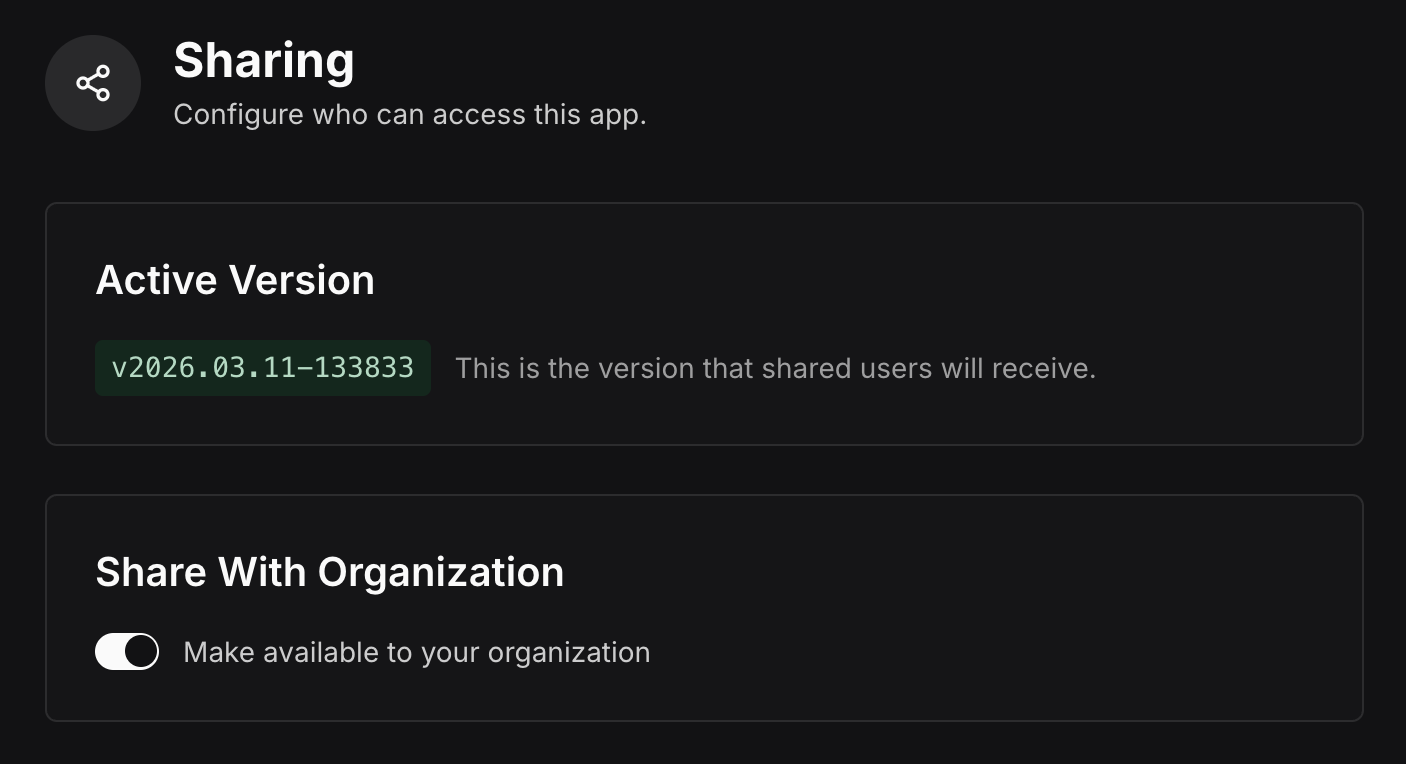
Share Across Teams
Publish to your org. Engineering, finance, and security all use the same tool. Everyone gets answers without learning a new console.
Share Across Teams
Publish to your org. Engineering, finance, and security all use the same tool. Everyone gets answers without learning a new console.
Replace Six Consoles with One Platform
We'll help you connect your cloud providers and build cost analysis, security audits, and deployment monitoring in your first working session.
Request a Demo