Every Team Gets Their Own Reports
Build self-service business intelligence on Synthetiq — connect your databases, SaaS tools, and APIs into one queryable layer. Ask questions in plain English, get live dashboards, scheduled reports, and full applications you can deploy to end-users. Every team becomes self-sufficient.
Reports Still Go Through One Overloaded Team
Every team needs reports. Every request routes to the same two analysts with a backlog measured in weeks. Traditional BI tools stop at dashboards, and self-service still demands SQL. Synthetiq goes further: connect your data once, let every team ask their own questions, and deploy what you build as real applications.
What Teams Build
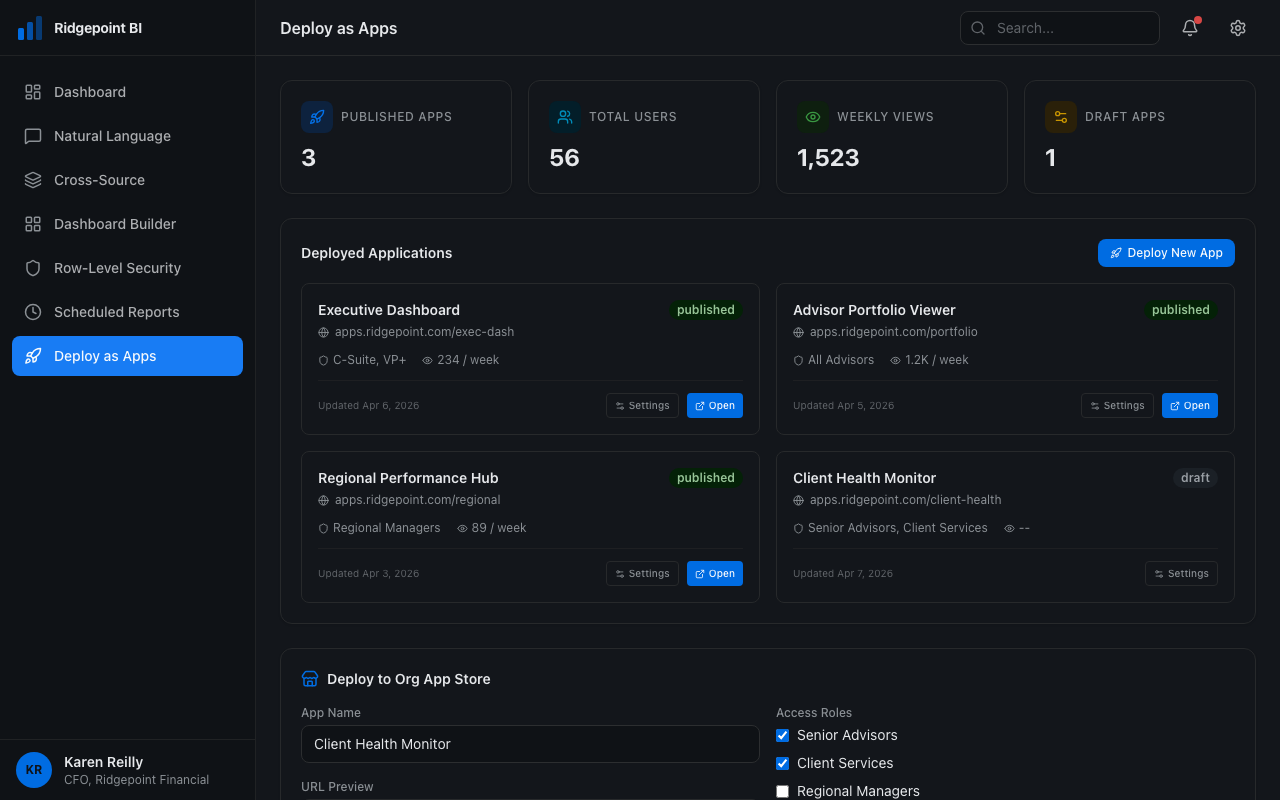
Go Beyond Dashboards
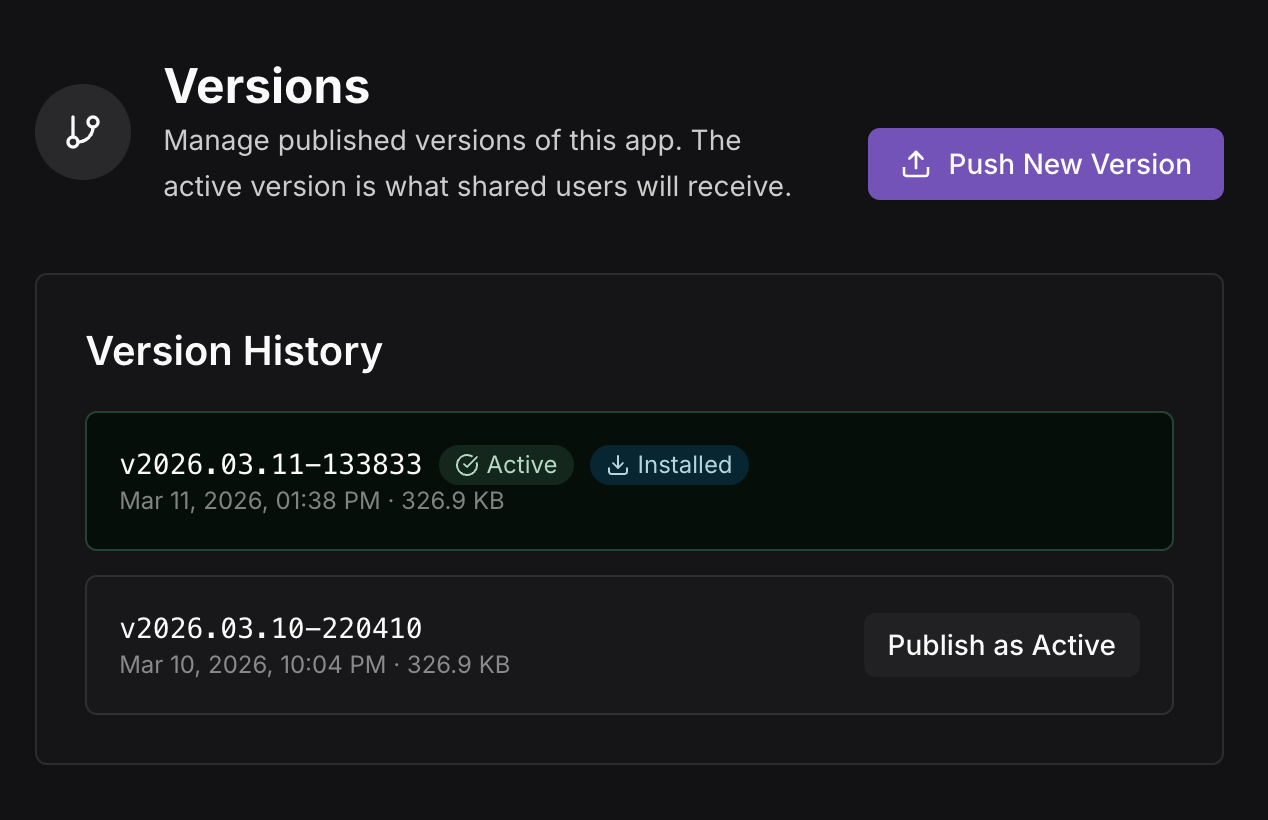
Most BI tools stop at dashboards. Synthetiq lets you turn any dashboard or workflow into a production application with authentication, role-based access, and its own URL. Deploy it to end-users, inside or outside your organization, through the Org App Store. Your dashboards become products.
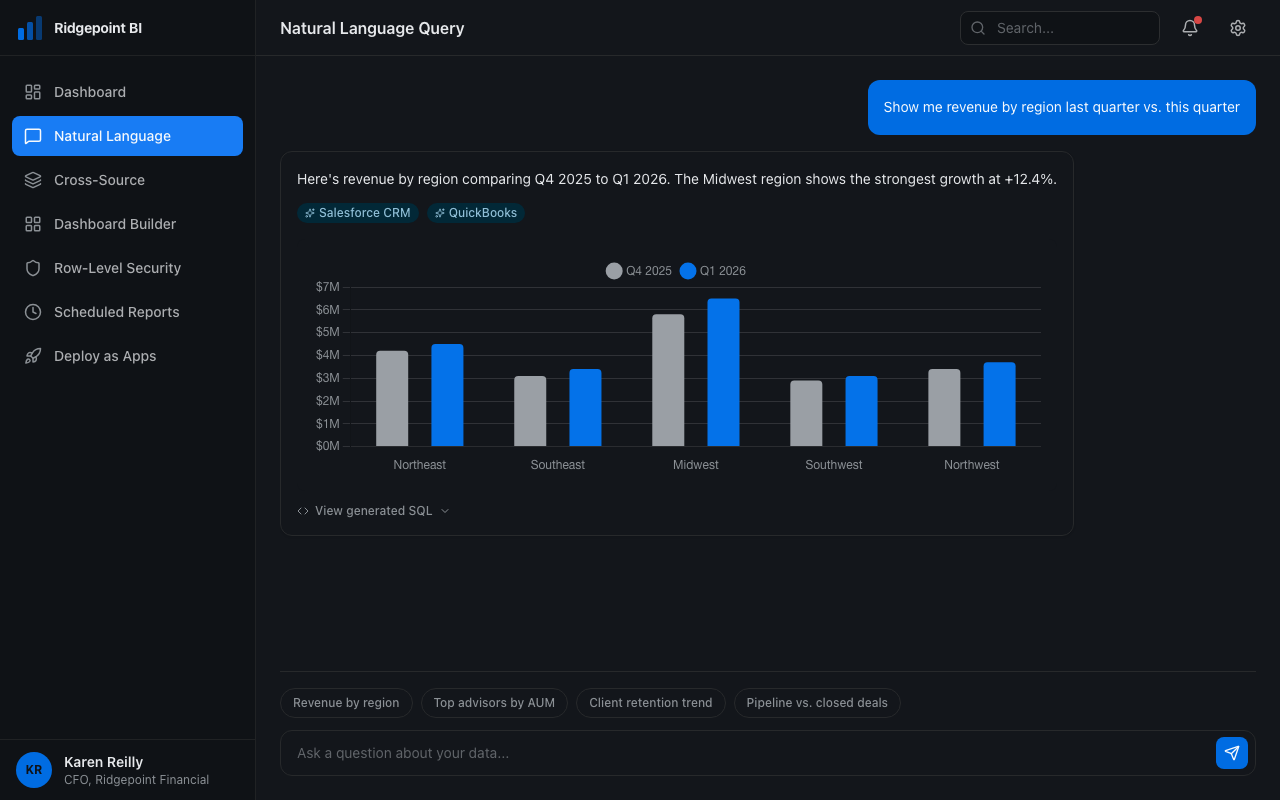
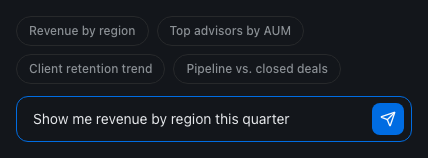
Ask in Plain English
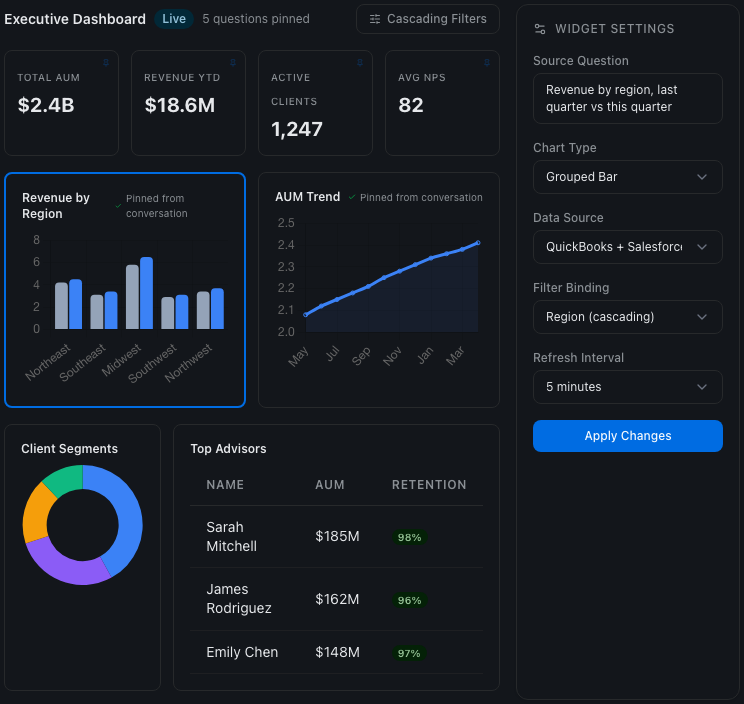
Type a question like "show me revenue by region last quarter vs. this quarter." Synthetiq translates it to the right query across your connected sources, returns a chart, and lets you pin it to a dashboard. Every generated query is reviewable so you can inspect the underlying logic before you share it. No SQL, no calculated fields, no training.
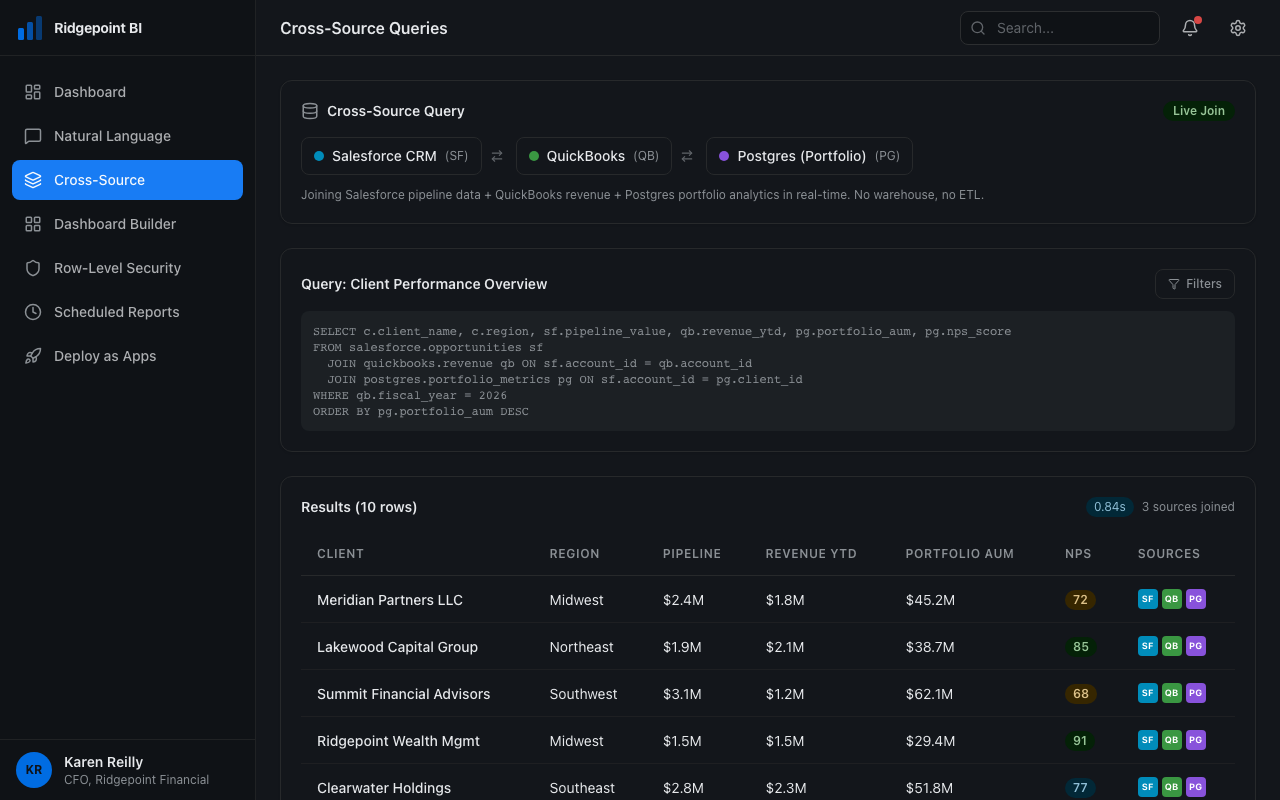
Query Across Every Source
Pull Salesforce pipeline, QuickBooks revenue, and Postgres product data into a single report. Synthetiq connects to your sources directly: databases, APIs, SaaS tools, or your existing data warehouse. Run apps locally for individuals or small teams, or deploy serverlessly with their own database for the whole organization. Every source you connect is immediately queryable alongside everything else.
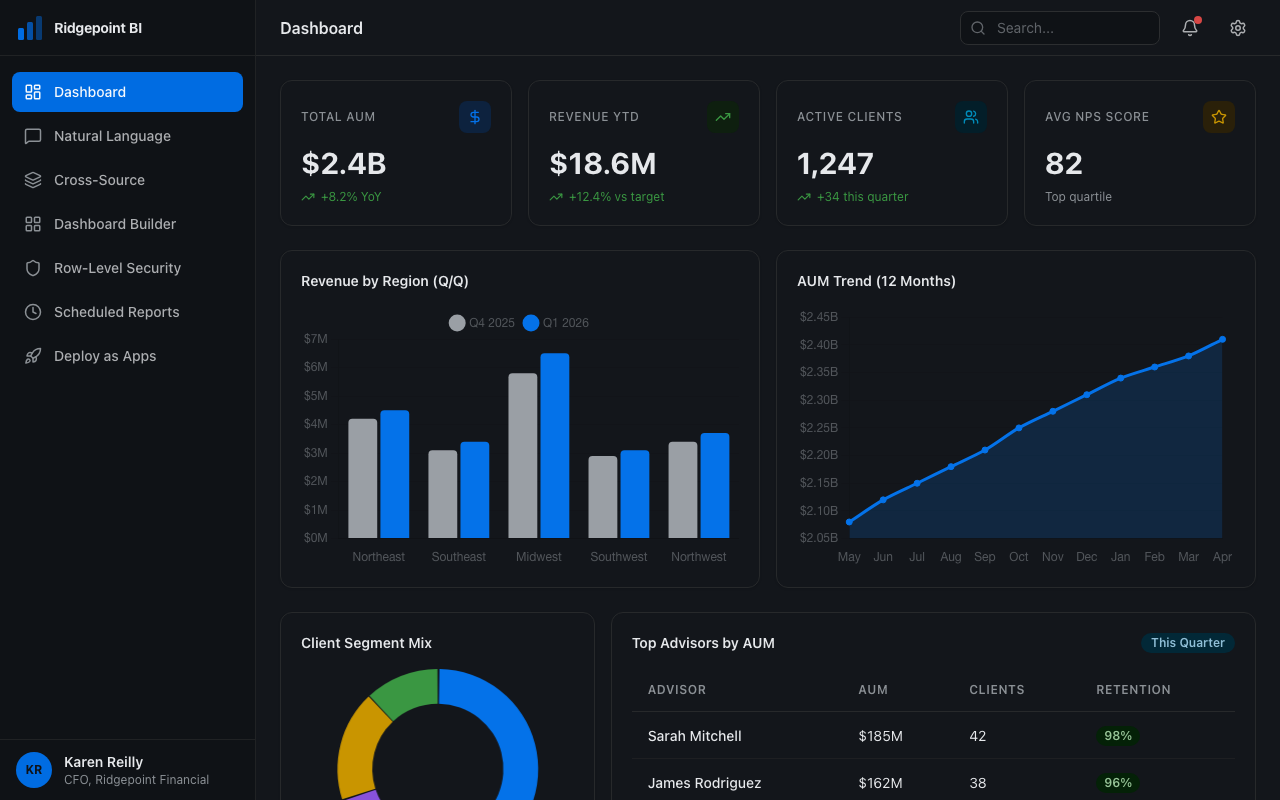
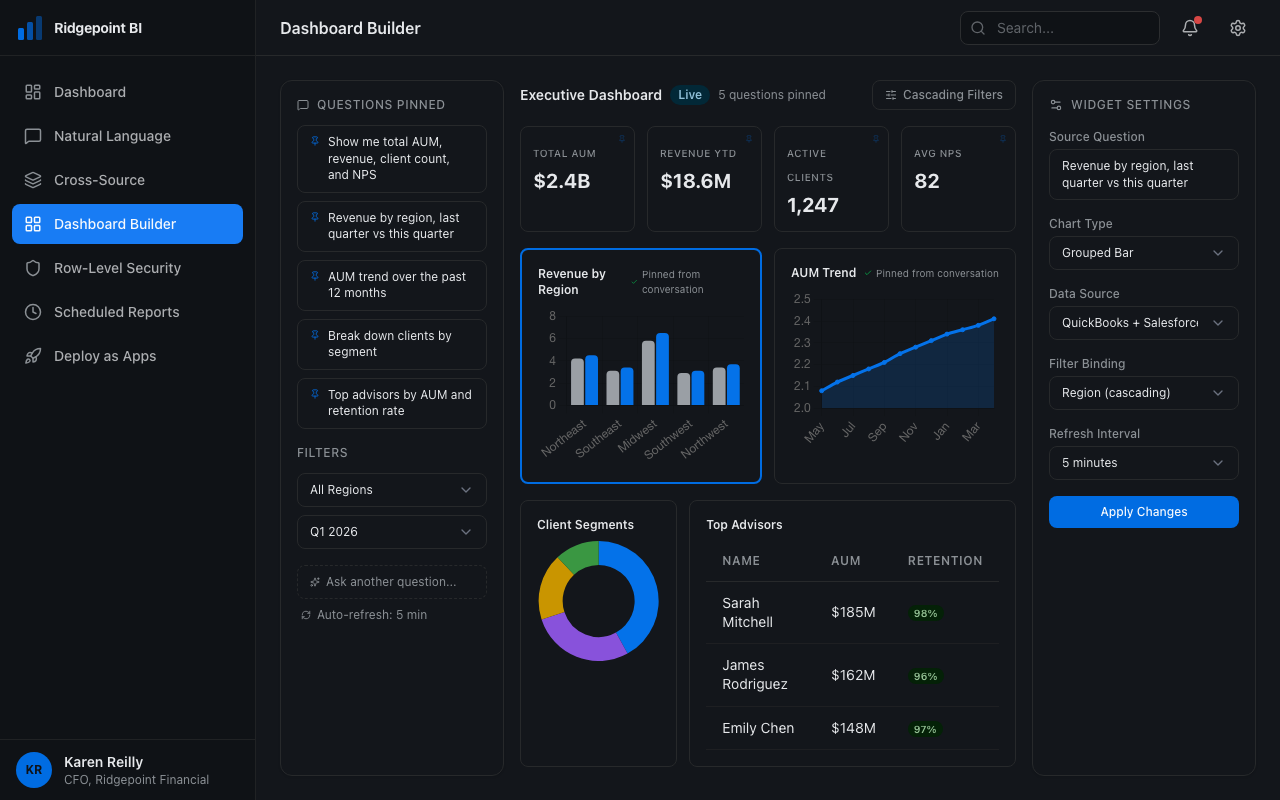
Dashboards from Conversation
Ask a question, pin the result to a dashboard. Keep asking — each answer becomes a new widget. Set filters that cascade across the board, share with your team, or lock it down with role-based access. Every dashboard is live, not a stale extract from last Tuesday.
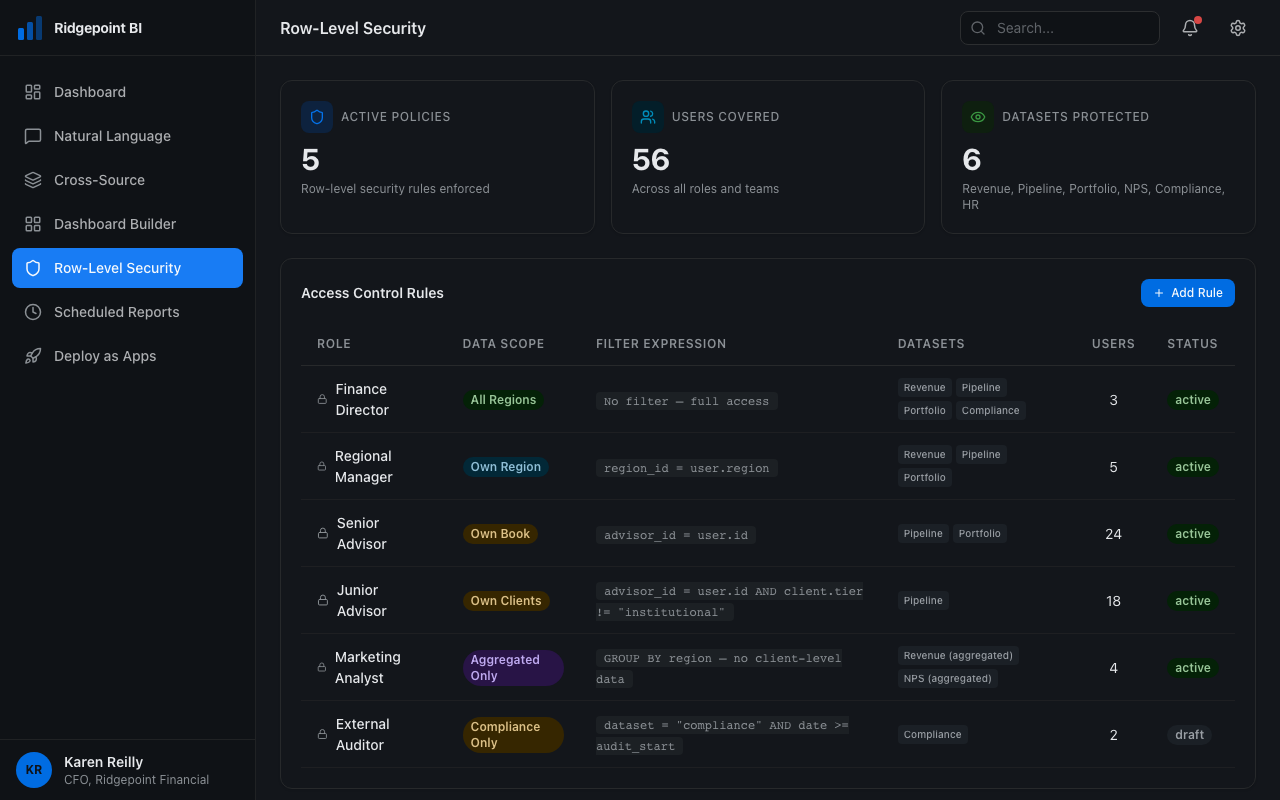
See Only What You Should
Finance sees all revenue. Regional managers see their region. Reps see their accounts. Row-level security applies automatically based on the viewer. One dashboard, many audiences. Works across both dashboards and deployed apps.
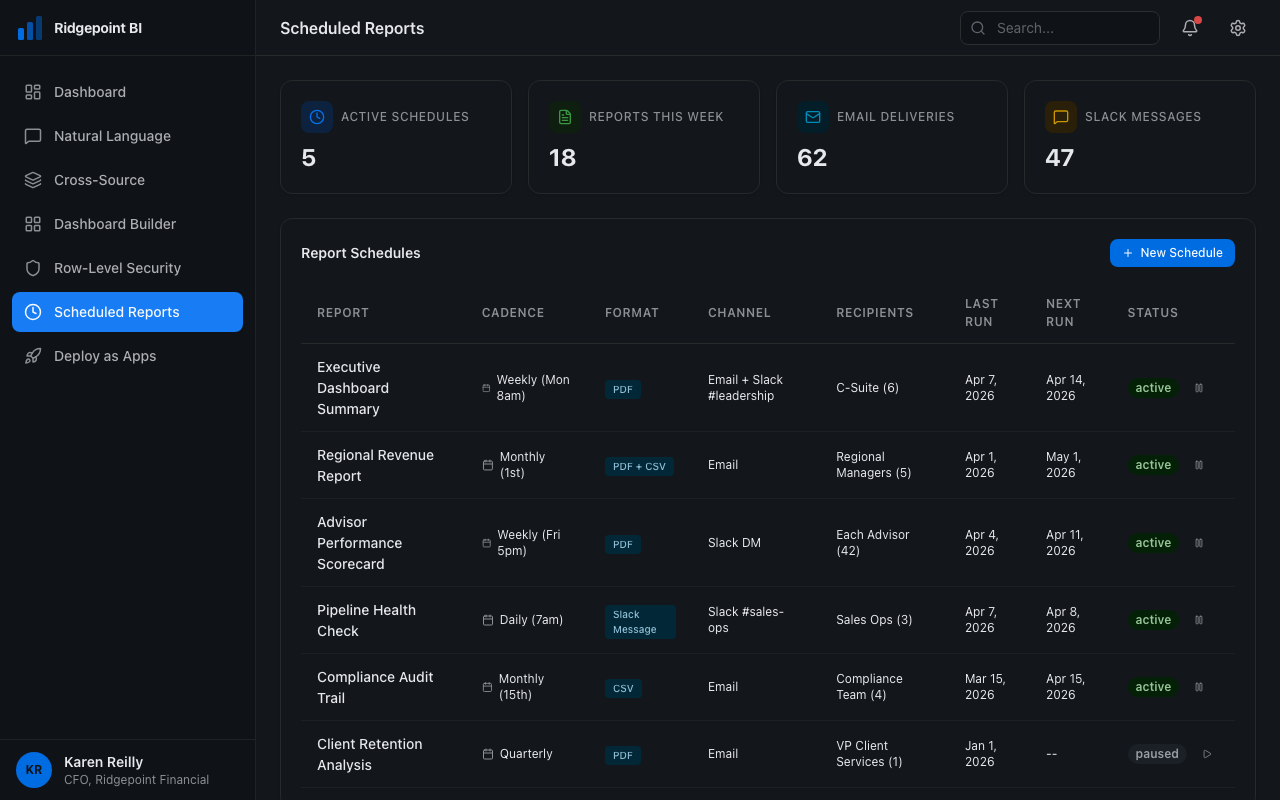
Reports That Send Themselves
Schedule any dashboard or query to run daily, weekly, or monthly. Results delivered as PDF, CSV, or embedded in Slack/email. Stakeholders who just need the numbers get exactly what they need, on time.
What Teams Build
Go Beyond Dashboards
Most BI tools stop at dashboards. Synthetiq lets you turn any dashboard or workflow into a production application with authentication, role-based access, and its own URL. Deploy it to end-users, inside or outside your organization, through the Org App Store. Your dashboards become products.
Ask in Plain English
Type a question like "show me revenue by region last quarter vs. this quarter." Synthetiq translates it to the right query across your connected sources, returns a chart, and lets you pin it to a dashboard. Every generated query is reviewable so you can inspect the underlying logic before you share it. No SQL, no calculated fields, no training.
Query Across Every Source
Pull Salesforce pipeline, QuickBooks revenue, and Postgres product data into a single report. Synthetiq connects to your sources directly: databases, APIs, SaaS tools, or your existing data warehouse. Run apps locally for individuals or small teams, or deploy serverlessly with their own database for the whole organization. Every source you connect is immediately queryable alongside everything else.
Dashboards from Conversation
Ask a question, pin the result to a dashboard. Keep asking — each answer becomes a new widget. Set filters that cascade across the board, share with your team, or lock it down with role-based access. Every dashboard is live, not a stale extract from last Tuesday.
See Only What You Should
Finance sees all revenue. Regional managers see their region. Reps see their accounts. Row-level security applies automatically based on the viewer. One dashboard, many audiences. Works across both dashboards and deployed apps.
Reports That Send Themselves
Schedule any dashboard or query to run daily, weekly, or monthly. Results delivered as PDF, CSV, or embedded in Slack/email. Stakeholders who just need the numbers get exactly what they need, on time.
From Question to Deployed App
Connect Your Data Sources
Link databases, SaaS tools, and APIs. Synthetiq auto-discovers schemas and relationships. Each source is available to every report and app from that point forward.

Connect Your Data Sources
Link databases, SaaS tools, and APIs. Synthetiq auto-discovers schemas and relationships. Each source is available to every report and app from that point forward.
Ask Your First Question
Type what you want to know in plain English. The platform generates the query, runs it, and returns a visualization. Refine with follow-ups like "break that down by quarter."
Ask Your First Question
Type what you want to know in plain English. The platform generates the query, runs it, and returns a visualization. Refine with follow-ups like "break that down by quarter."
Build Dashboards and Apps
Every question you ask can become a dashboard widget. Add filters, set refresh intervals, and share with teammates. When a dashboard outgrows its format, promote it to a full application with authentication and its own deployment.
Build Dashboards and Apps
Every question you ask can become a dashboard widget. Add filters, set refresh intervals, and share with teammates. When a dashboard outgrows its format, promote it to a full application with authentication and its own deployment.
Deploy to End-Users
Publish apps to your Org App Store. External stakeholders, clients, or field teams get a purpose-built interface, not a BI login. Your data team focuses on data quality, not report requests.
Deploy to End-Users
Publish apps to your Org App Store. External stakeholders, clients, or field teams get a purpose-built interface, not a BI login. Your data team focuses on data quality, not report requests.
From Question to Dashboard to Deployed App
First dashboard in one conversation. Connect your data sources, ask a question, and watch it become a live dashboard, then a deployed app. We'll walk through the full path in your first working session.
Request a Demo